Stock Trading Guide
- Written By thinkforexbrokers
- Updated:
People often see the stock market in very different ways. Some believe they can strike it rich with a single trade, while others shy away completely, unable to handle the risks of such a fast-moving environment. Usually, the first group is fueled by ambition—or sometimes greed—while the second group is held back by fear.
Yes, trading stocks carries risk. But with a disciplined strategy, it’s possible to steadily grow your trading capital over time. In this guide, we’ll break down how the stock market works and walk you through the key aspects of equity trading on some of the world’s largest exchanges. Before we dive in, let’s start with a few basics.
Stock Trading Statistics | |
Stock Market Statistics | Stock Trading Demographics |
Most Traded Sectors in Global Equity Markets | |
What do Shares/Stocks actually represent?
Stocks, often called shares, are basically pieces of a company that you can own. When you buy a stock, you’re buying a small slice of that business, which means you have a right to a portion of its assets and profits. How big your share is depends on how many stocks you own compared to the total number of shares the company has issued.
For example, let’s say a company has 2 million shares in total, and you (or an investment firm) own 25,000 of them. That would mean you own 1.25% of the company. Simple as that—you’re literally a part-owner.
What types of Shares/Stocks are there?
You’ve basically got two main types of shares in the corporate world — common shares and preferred shares.
Common shares are what most people think of when they hear the word “stocks.” If you own them, you usually get to vote at company meetings, like the yearly shareholder gathering where big decisions happen. Most companies give one vote per share, but some mix it up. For example, a business might have Class A shares with ten votes each and Class B shares with just one. That’s usually done so the original founders can keep control of the company’s direction, even if they don’t own most of the stock anymore.
Preferred shares are a different story. You don’t usually get voting rights with these, but you do get first dibs when it comes to dividends or if the company’s assets are being split up after liquidation.
These days, when people talk about “equities,” they’re almost always talking about common shares. They’re simply way more common in the market and get traded a lot more than preferred ones.
What does Initial Public Offering (IPO) mean?
Starting a business isn’t cheap — most new companies need a fair bit of money just to get off the ground. Usually, that cash comes in one of two ways: either you borrow it from a bank (that’s debt) or you sell part of the business in the form of shares (that’s equity).
Now, as time goes on and the business grows, there’s a good chance the owners will need more money than daily sales or another loan can cover. When that happens, some companies decide to “go public.” Basically, they put their shares up for sale to everyday people through something called an Initial Public Offering, or IPO for short.
Doing this changes the game — instead of a few people holding all the control, the company now has loads of different shareholders. Early investors often use this moment to sell some of their shares and lock in a nice profit.
Once those shares hit the stock market, their price starts bouncing around. It goes up and down as buyers and sellers keep rethinking what they believe the company’s really worth.
What does intrinsic value of a stock mean?
When analysts try to figure out what a company’s stock is really worth, they use different models to get what’s called the “intrinsic value.” Think of it as the stock’s true, underlying value—not just what people are paying for it today. If there’s a gap between the current market price and that calculated value, it could be a signal for an investment opportunity.
In simple terms, if a stock is trading for less than what the numbers suggest it’s worth, it might be a good time to buy. If it’s priced higher than its estimated true value, that could be your cue to sell.
To work out that intrinsic value, analysts often use methods like
- Dividend Discount Models
- Residual Income Models
- Discounted Cash Flow Models
How can Stocks be classified?
Stocks are generally categorized in two main ways: by market capitalization and by sector. Market capitalization, often shortened to “market cap,” refers to the total value of a company’s outstanding shares in the market. It’s calculated by multiplying the number of shares the company has issued by their current market price. Based on size, companies with a market value between $300 million and $2 billion are typically considered small-cap, those between $2 billion and $10 billion are seen as mid-cap, and companies worth more than $10 billion fall into the large-cap category.
When it comes to sector classification, the most widely used system is the Global Industry Classification Standard (GICS), introduced in 1999 by MSCI and S&P Dow Jones Indices. This framework organizes businesses into 11 broad sectors and 25 industry groups, offering a clear view of the diversity and structure of the global economy.
- Industrials
- Materials
- Energy
- Health Care
- Financials
- Consumer Staples
- Consumer Discretionary
- Communication Services
- Information Technology
- Real Estate
- Utilities
ChatGPT said:
Cautious investors usually stick with sectors that feel safe and steady things like consumer staples, utilities, or health care because they tend to pay decent dividends and don’t bounce around too much in price. Meanwhile, risk-takers often go for sectors like energy, finance, or tech, where the prices can swing a lot more but the potential rewards are bigger.
What is a Stock Market Index?
Besides looking at individual company shares, many investors keep a close watch on stock indices. A stock index basically shows the combined value of a group of selected stocks, giving a snapshot of how that part of the market is performing. When the index moves up or down, it’s simply reflecting the overall changes in the prices of all the stocks it includes. Well-known examples include the S&P 500, the Dow Jones Industrial Average, and the FTSE 100.
Stock indices are often seen as a useful way to gauge how a particular stock market is doing. Most of them are weighted by market capitalization, meaning each stock’s influence on the index depends on how big the company is in terms of total market value. There are also price-weighted indices, like the Dow Jones Industrial Average, which tracks 30 major blue-chip companies in the U.S., giving more weight to stocks with higher prices.
Here are some of the most important stock indices investors should watch closely:
- US S&P 500
- Dow Jones 30 Industrial Average
- NASDAQ 100
- S&P/TSX Composite Index in Canada
- FTSE 100 in the UK
- CAC 40 in France
- DAX 40 in Germany
- IBEX 35 in Spain
- IBOVESPA in Brazil
- Hang Seng in Hong Kong
- Nikkei 225 in Japan
- TOPIX in Japan
- CSI 300 in China
- Shanghai Composite in China
- S&P ASX 200 in Australia
- SENSEX in India
- KOSPI in South Korea
What is a Stock Exchange?
A stock exchange is basically a secondary market — a place where people who already own shares can sell them to others who want to buy. The company itself isn’t directly involved in these trades. When you buy a stock, you’re purchasing it from another investor, not the company. And when you sell, you’re selling to another investor, not “giving it back” to the business.
You might wonder how buyers and sellers actually find each other. On many exchanges, this is handled by professional traders called market makers or specialists. They keep the market moving by constantly posting prices they’re willing to buy (bids) and sell (asks) at. The bid is the highest price someone is willing to pay, while the ask is the lowest price a seller will accept. The gap between them is called the spread. A small spread, along with high trading activity, usually means a stock is highly liquid — easy to buy and sell without big price changes. Good “market depth” happens when there’s plenty of trading volume and only tiny differences between bids and asks.
In the past, matching buyers and sellers was a much noisier, more chaotic process. Traders would shout and use hand signals in a system called “open outcry” to make deals on the exchange floor. Most of that has been replaced by electronic trading, which matches trades almost instantly, reduces costs, and speeds up execution.
In many developed countries, stock exchanges act as self-regulatory organizations. This means they set and enforce their own rules to ensure fair play and protect investors — focusing on ethics, transparency, and equal treatment. In the U.S., for example, organizations like NASD and FINRA play a big role in keeping markets fair.
Today, exchanges all over the world are connected electronically, making the stock market more efficient and liquid than ever before.
Which are the largest stock exchanges worldwide?
The New York Stock Exchange (NYSE) is the largest and most well-known stock exchange in the world, and its history goes back more than two centuries. It all began in 1792 when 24 New York City stockbrokers and merchants signed the Buttonwood Agreement. Before there was an official exchange, these traders would meet under a buttonwood tree on Wall Street to buy and sell shares. In 1817, they made things more formal, reorganizing as the New York Stock and Exchange Board — the foundation of today’s NYSE.
The NYSE is open for trading Monday through Friday from 9:30 a.m. to 4:00 p.m. Eastern Time, with closures on major U.S. holidays like New Year’s Day, Martin Luther King Jr. Day, Washington’s Birthday, Good Friday, Memorial Day, Independence Day, Labor Day, Thanksgiving, and Christmas. On the day before Independence Day and on the days after Thanksgiving and Christmas Eve, the exchange closes early. All told, the NYSE operates around 253 trading days a year.
The NYSE and NASDAQ are the two biggest stock exchanges in the world based on the total market capitalization of their listed companies. The United States alone currently has 20 stock exchanges registered with the Securities and Exchange Commission (SEC), most of which are owned by the NYSE, NASDAQ or CBOE.
Based on data published by the World Federation of Exchanges in February 2025, the 19 largest stock exchanges worldwide by total market capitalization as of December 2024 were the following:
Rank | Stock Exchange | Location | Market Capitalization (in trillion USD) | Monthly Trade Volume (in trillion USD) |
1 | New York Stock Exchange | United States | 31.6 | 2.7 |
2 | NASDAQ | United States | 30.6 | 2.7 |
3 | Shanghai Stock Exchange | China | 7.2 | 1.9 |
4 | Japan Stock Exchange | Japan | 6.56 | 0.65 |
5 | Euronext | Europe | 5.44 | 0.19 |
6 | National Stock Exchange of India | India | 5.13 | 0.29 |
7 | Shenzhen Stock Exchange | China | 4.5 | 2.8 |
8 | London Stock Exchange | United Kingdom | 3.52 in £ (about 4.5 in $) | 0.065 in £ (about 0.0815 in $) |
9 | Toronto Stock Exchange (TMX Group) | Canada | 3.55 | 0.20 |
10 | Saudi Exchange | Saudi Arabia | 2.6 | 0.03 |
11 | Taiwan Stock Exchange | Taiwan | 2.26 | 0.22 |
12 | Deutsche Boerse AG | Germany | 2.04 | 0.077 |
13 | Tehran Stock Exchange | Iran | 1.99 | 0.04 |
14 | SIX Swiss Exchange | Switzerland | 1.97 | 0.054 |
15 | ASX Australian Securities Exchange | Australia | 1.89 | 0.09 |
16 | Nasdaq Nordic and Baltics* | Europe | 1.79 | 0.047 |
17 | Korea Exchange | South Korea | 1.56 | 0.05 |
18 | Indonesia Stock Exchange | Indonesia | 0.83 | 0.014 |
19 | Abu Dhabi Securities Exchange | Abu Dhabi | 0.82 | 0.0006 |
This group includes several exchanges — the Copenhagen, Stockholm, Helsinki, Tallinn, Riga, Vilnius, and Iceland Stock Exchanges.
Below is a table showing the number of companies listed on the 10 largest stock exchanges by market capitalization as of the end of 2024. The figures are current as of April 2025.
Stock Exchange | Number of listed companies |
New York Stock Exchange | 2,132 |
NASDAQ | 3,289 |
Shanghai Stock Exchange | 2,278 |
Japan Stock Exchange Group | 3,966 |
National Stock Exchange of India | 2,668 |
Euronext | 1,858 |
Hong Kong Stock Exchanges | 2,631 |
Shenzhen Stock Exchange | 2,852 |
London Stock Exchanges | 1,681 |
TMX Group | 3,569 |
Let’s now look at the 50 publicly traded companies with the highest market capitalization worldwide, based on data from April 2025. This list includes only companies whose shares are traded on the stock market.
Rank | Company Name | Market Capitalization | Country |
1 | Apple | $3.07 trillion | USA |
2 | Microsoft | $2.78 trillion | USA |
3 | NVIDIA | $2.51 trillion | USD |
4 | Amazon | $1.92 trillion | USA |
5 | Alphabet (Gooogle) | $1.91 trillion | USA |
6 | Saudi Aramco | $1.66 trillion | Saudi Arabia |
7 | Meta Platforms | $1.31 trillion | USA |
8 | Berkshire Hathaway | $1.14 trillion | USA |
9 | Broadcom | $831.82 billion | USA |
10 | TSMC | $818 billion | Taiwan |
11 | Tesla | $807.62 billion | USA |
12 | Walmart | $761.28 billion | USA |
13 | Eli Lilly | $744.81 billion | USA |
14 | JPMorgan Chase | $669.42 billion | USA |
15 | Visa | $645.00 billion | USA |
16 | Tencent | $559.39 billion | China |
17 | Mastercard | $483.21 billion | USA |
18 | Exxon Mobil | $464.40 billion | USA |
19 | Netflix | $446.67 billion | USA |
20 | Costco | $432.96 billion | USA |
21 | United Health | $389.53 billion | USA |
22 | Procter & Gamble | $388.61 billion | USA |
23 | Johnson & Johnson | $374.44 billion | USA |
24 | Oracle | $368.47 billion | USA |
25 | Home Depot | $354.25 billion | USA |
26 | ICBC | $324.93 billion | China |
27 | SAP | $320.04 billion | Germany |
28 | Coca-Cola | $315.45 billion | USA |
29 | AbbVie | $313.19 billion | USA |
30 | T-Mobile | $294.79 billion | USA |
31 | Bank of America | $292.95 billion | USA |
32 | Alibaba | $285.47 billion | China |
33 | Hermes | $277.51 billion | France |
34 | LVMH | $276.52 billion | France |
35 | Novo Nordisk | $275.90 billion | Denmark |
36 | Nestle | $269.82 billion | Switzerland |
37 | Kweichow Moutai | $267.20 billion | China |
38 | Agricultural Bank of China | $263.49 billion | China |
39 | Philip Morris International | $261.66 billion | USA |
40 | ASML | $258.71 billion | Netherlands |
41 | Samsung | $256.01 billion | South Korea |
42 | Roche | $248.50 billion | Switzerland |
43 | Salesforce | $240.71 billion | USA |
44 | International Holding Company | $239.55 billion | UAE |
45 | Chevron | $238.74 billion | USA |
46 | Toyota | $236.45 billion | Japan |
47 | Palantir | $236.45 billion | USA |
48 | China Mobile | $228.88 billion | China |
49 | McDonald | $227.73 billion | USA |
50 | IBM | $227.62 billion | USA |
What is a “block”?
In stock trading, the term “block” refers to large transactions involving either a significant number of shares or a high notional value. Typically, a block consists of at least 10,000 shares of a company’s stock or a trade worth $200,000–$250,000 or more.
Block trades make up nearly 20% of the total trading volume on the NASDAQ, according to market data. They are commonly used by mutual funds, hedge funds, banks, and insurance companies, as these institutions often rely on them for long-term strategies or to quickly adjust market exposure.
In addition, corporate stock buybacks are often carried out through block trading. To minimize sudden price swings, many of these trades take place outside the open market.
How is the Stock of a company priced?
There are different methods to determine a company’s share price on the stock market, but the most common one is through auctions based on bids and offers. A bid is the price at which a participant is willing to buy shares, while an offer is the price at which another is willing to sell. When the bid and offer meet at the same level, a trade takes place.

Millions of traders and investors participate in stock trading, each with their own view of a stock’s value. As a result, the prices at which they are willing to buy or sell vary. Their constant buying and selling creates ongoing price fluctuations throughout the trading day.
The gap between the bid and ask price is called the spread. It shows the difference between the highest price a buyer is prepared to pay and the lowest price a seller is ready to accept. A trade happens when the buyer agrees to the ask price or when the seller accepts the bid.
The stock market works as a clear example of supply and demand. When buyers outnumber sellers, stock prices tend to rise as buyers increase their bids and sellers raise their asking prices. When sellers dominate, prices fall as sellers lower their asks and buyers reduce their bids.
Stock exchanges provide the platform where these orders are matched. Individual investors can access these exchanges through stockbrokers, who act as intermediaries between buyers and sellers.
What does a Stockbroker do?
When it comes to broker licensing requirements, the rules vary depending on the country and its financial regulatory body. In the United States, brokers and broker-dealers must be registered with FINRA and the Securities and Exchange Commission (SEC). In the United Kingdom, brokers are regulated by the Financial Conduct Authority (FCA), while in the European Union oversight is carried out under the Markets in Financial Instruments Directive (MiFID II). In Japan, brokerages are supervised by the Financial Services Agency (FSA), and in Australia they must hold an Australian Financial Services Licence issued by the Australian Securities and Investments Commission (ASIC).
Regardless of the jurisdiction, the licensing process typically involves meeting certain capital requirements, passing examinations, and adhering to strict compliance rules aimed at protecting investors. Licensed brokers are required to follow transparency standards, maintain fair dealing practices, and ensure their clients are well informed about the risks of investing. These safeguards are designed to uphold confidence in financial markets and protect investors from malpractice.

In the United States, registered stockbrokers are required to have the FINRA Series 7 and Series 63 or 66 licenses, while they have to be sponsored by a registered investment firm

In the United Kingdom, stockbrokers must obtain approval from the Financial Conduct Authority (FCA)

In Canada, stockbrokers must successfully complete the Canadian Securities Conduct and Practices Handbook Course as well as the 90-day Investment Advisor Training Program

In Singapore, to become a stockbroker, one needs to pass several exams – Modules 1A, 5, 6 and 6A, which are administered by the Institute of Banking and Finance. Licenses are provided by the Monetary Authority of Singapore (MAS) and the Singapore Exchange

In Hong Kong, to become a stockbroker, one should be employed by a licensed brokerage firm and pass three exams administered by the Hong Kong Securities Institute. Once they pass the exams, candidates must seek approval from Hong Kong’s financial regulatory authority to obtain a broker license.
The rise of online trading platforms has dramatically reshaped the brokerage landscape. Investors now enjoy direct access to the markets through user-friendly mobile apps and web-based platforms, often at little to no cost. This has democratized trading, opening doors for small-scale investors who previously could not afford the high fees charged by traditional full-service brokers.
At the same time, the competition among discount brokers has intensified, leading to the introduction of additional features beyond simple order execution. Many firms now provide educational resources, research tools, and advanced charting software to attract and retain clients. Robo-advisers have also gained traction by offering automated portfolio management, tailoring investment strategies to individual risk profiles and goals at a fraction of the cost of human advisers.
Despite these advancements, the fundamentals of brokerage remain unchanged: connecting buyers and sellers in financial markets. What has evolved is the speed, convenience, and affordability of access, allowing everyday investors to participate on a more level playing field with institutions.
What are the advantages and disadvantages of Stock Exchange listing?
A company listed on a reputable stock exchange will certainly benefit from:
Access to liquidity for shares that its shareholders own
Opportunity to set up stock options plans more easily. Such initiatives are crucial for luring highly coveted professionals to work in the company
Opportunity to raise more funds by issuing additional shares.
A publicly traded company can use listed shares to make acquisitions, where part or the entire amount is paid in stock

A publicly traded company becomes “more visible” in the marketplace. The price of its shares can rise as a result of analyst coverage or higher demand from institutional investors.
There are, of course, certain disadvantages associated with stock exchange listing:
Initial public offerings (IPOs) are associated with considerable expenses for a company, including listing fees and reporting costs
Second, exchange regulations may be too stringent and affect the company’s ability to run its business operations
And third, the majority of investors tend to focus more on short-term outcomes. As a result, many companies allocate most of their resources for objectives such as exceeding analyst estimates for quarterly earnings and revenue, for example, instead of focusing on their long-term corporate strategy.
Let’s now look at some practical factors to consider before you start trading stocks. To succeed, you’ll need a clear strategy, solid knowledge of the market, and the discipline to stay consistent.
Day Trading and Swing Trading
There are two common ways to approach the stock market: short-term trading or taking advantage of medium-term price movements. It is also important to distinguish between active trading and long-term investing. Investing usually spans months or years, while active trading focuses on shorter timeframes. Within active trading, day trading and swing trading are two of the most widely used methods.
Day trading involves opening and closing positions within the same trading day. Depending on price volatility, trades can last anywhere from a few seconds to several hours. Day traders rely heavily on technical analysis, using indicators such as moving averages, RSI, MACD, and Bollinger Bands. They often study chart patterns to spot potential trend continuations or reversals.
Swing trading, on the other hand, takes a more medium-term approach. Positions are typically held for several days to weeks, sometimes even months. Swing traders use both technical and fundamental analysis—tracking economic events, political developments, corporate news, and company earnings to identify opportunities.
When deciding between these approaches, consider factors like your time commitment, risk tolerance, trading capital, and preferred style of analysis.
- your total investment objectives
- the time horizon required for achieving those objectives
- your risk tolerance
- the time you need to spend educating yourself.
Creating a trading account with a stockbroker
Retail investors need to open a brokerage account in order to access tradable assets such as stocks, bonds, mutual funds, and more. Much like a regular bank account, a brokerage account lets you deposit and withdraw funds, but it also provides direct access to financial markets.
Opening an online trading account today is quick and straightforward. Most leading discount brokers—such as TD Ameritrade, Interactive Brokers, or eToro—welcome new traders and offer commission-free stock trading with low or reasonable minimum deposits.
Before getting started, it is important to understand the steps involved in opening an account.
The first step is to decide how much support you need from your broker. Different types of trading accounts come with their own pros and cons. You should research the brokerage carefully, including its account options, platform features, trading conditions, and whether they align with your financial goals. Pay close attention to factors such as fees, user-friendliness of the platform, minimum deposit requirements, and the availability of educational or research resources. Many top brokerages now provide interactive learning materials and market insights on their websites or blogs.
Most brokers typically offer two main types of accounts: self-managed and managed. A self-managed account is handled entirely by you, which is suitable if you already have the knowledge and confidence to trade independently. A managed account, on the other hand, is overseen by a professional investment advisor employed by the brokerage. This may be a good choice if you are still building confidence or prefer expert guidance.
Once you have chosen your broker, the second step is registering for a trading account. The sign-up process usually takes about 10 to 15 minutes. During registration, you will be asked to provide key personal and financial information to set up your account.
personal information such as full name, mailing address, phone number, social security number, current financial situation and assets
information about your tax status – in the application form, the brokerage may require you to answer questions such as whether you are opening the account as an individual or as a business entity, whether you are filing individually or jointly with your spouse and so on
information concerning your personal risk tolerance – the application form may include questions about your investment experience, investment strategy and investment objectives as well as knowledge of risk management
You must also prepare copies of your identity documents to pass the obligatory identity verification check.
After registering, the next step is to fund your brokerage account. Some brokers set a minimum deposit requirement, which you will need to meet. It’s important to carefully consider how much money you can invest without putting strain on your monthly budget. Since stock trading carries risk and returns are never guaranteed, avoid committing funds you cannot afford to lose.
Detecting “the best” Stocks to buy in the market now
When trading, you should focus on finding stocks with the greatest potential to make a strong move. This is where a reliable stock screener becomes invaluable. Most major brokerages now provide built-in or highly customizable screeners that let you filter stocks by criteria such as market capitalization, analyst ratings, percentage price changes, industry, or region. For example, TD Ameritrade’s Thinkorswim platform is considered a solid choice. However, using a stock screener is only the starting point in the overall trading process.
High Volume as indicator in Stock trading
Seasoned traders will often say that volume is the first indicator they look at when evaluating a stock. High trading volume usually signals stronger price volatility, and volatility creates more opportunities for active traders to buy and sell at favorable price levels.
When a stock shows above-average or unusual volume, it’s often linked to a catalyst. This doesn’t always mean a company-specific event or financial report—it can also be driven by broader industry news. A good example is the surge of interest in electric vehicle stocks in 2020. Even without individual company announcements, most stocks in the sector rallied due to industry-wide speculation.
Spotting unusually high volume in a stock or sector can reveal trading opportunities that many beginners overlook. Fortunately, some stock screeners highlight “unusual volume” stocks, making it easier for traders to identify these opportunities.
Stock market news
News can be a powerful driver of stock price movement, whether it relates to a specific company or an entire industry. Major announcements such as mergers, acquisitions, or FDA approvals often push a company’s stock price higher.
At times, however, a stock may experience sharp movements without any clear news or event behind it. In such cases, the likely cause is market speculation, where traders are reacting to expectations rather than facts.
The VWAP technical indicator
Both day traders and swing traders often rely on the volume-weighted average price (VWAP) as a key technical indicator. VWAP shows the average price at which a stock has traded during a session, factoring in both price and trading volume. Traders use it to spot stocks moving near their VWAP level. When combined with a volume indicator, it can help filter out noise and highlight trending stocks that are actively testing VWAP zones.
VWAP is most often applied to intraday charts, giving a clear view of a stock’s average trading price throughout the day. If the price stays above the VWAP line, it generally signals bullish sentiment, while trading below it usually points to a bearish outlook.
High float and Low float Stocks
Stock float is another important concept in day trading. It represents the number of shares available for public trading, excluding those held by company insiders or employees. In other words, it reflects the actual supply of shares that investors can buy and sell on the open market.
Traders often look at float size to gauge supply and demand. A high float means more shares are available, so it usually takes heavier trading activity to move the price. A low float, on the other hand, can lead to sharp price swings when trading volume surges, as the limited supply creates greater volatility.
With that in mind, let’s move on to chart patterns—technical analysis tools that day traders and swing traders use to spot opportunities. Learning to recognize bullish patterns can help you buy at lower levels and sell at higher ones, taking advantage of uptrends.
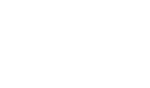
The Golden Cross Pattern
One of the most well-known chart patterns among traders is the Golden Cross. This setup uses two moving averages: a short-term average (commonly the 50-day) and a long-term average (commonly the 200-day). The Golden Cross appears when the short-term MA rises above the long-term MA, signaling potential bullish momentum.
When applied to larger timeframes, such as daily or weekly charts, the Golden Cross often suggests stronger and longer-lasting upward trends, making it a favorite pattern for spotting breakout opportunities.
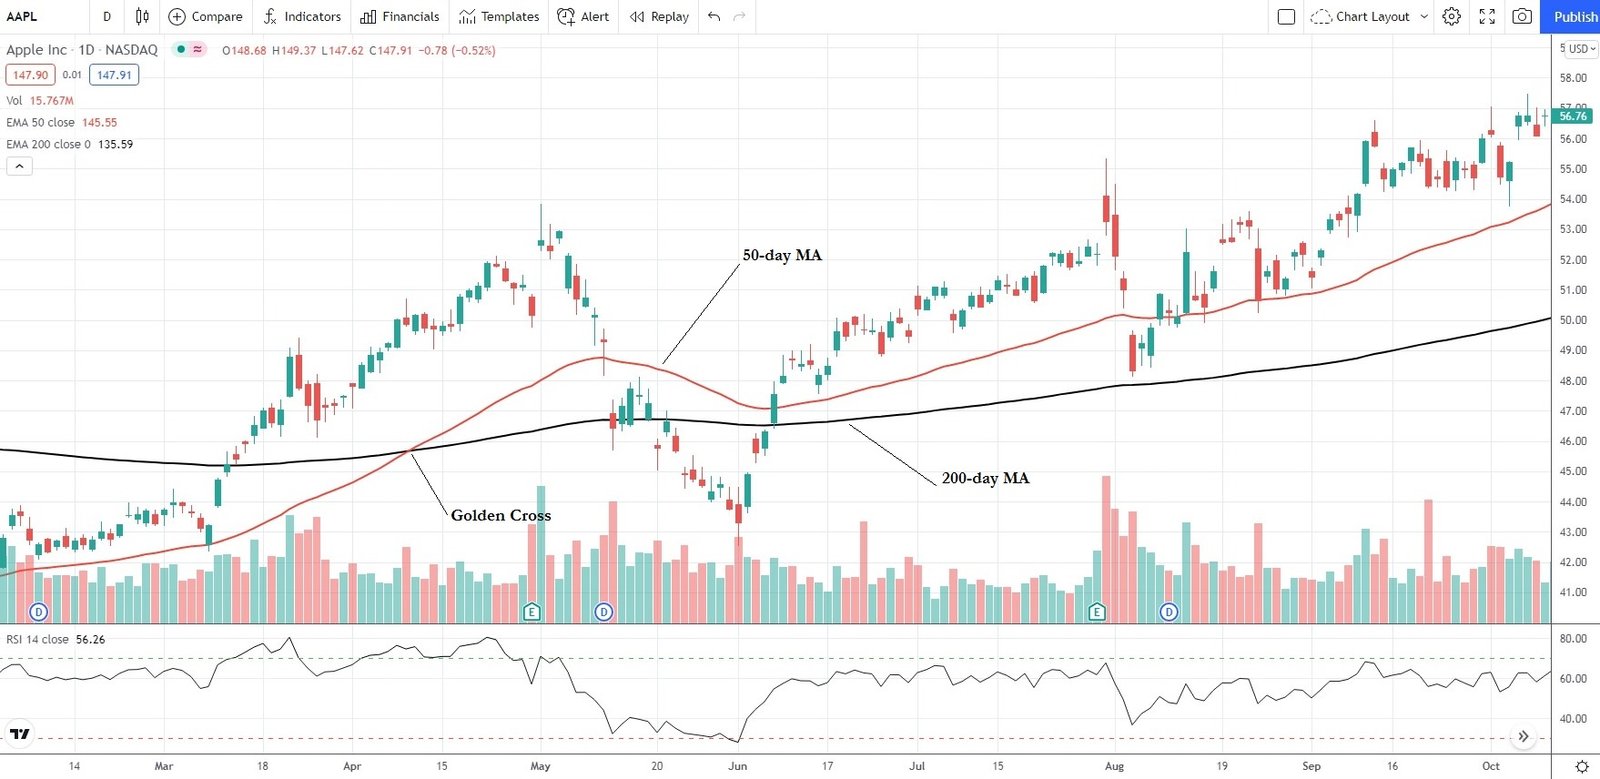
The Double Bottom Pattern
The Double Bottom pattern, often described as a “W-shaped” setup, signals a potential reversal in a stock’s downtrend. It forms when the stock price drops to a notable low, rebounds, then falls again to a similar level before bouncing back once more. This repeated rebound suggests strong support at that price zone.
Traders typically look to enter positions after the second bounce, once the stock shows signs of rallying. While the pattern can appear across different timeframes, it’s generally considered more reliable on larger charts, where the trend reversal carries greater weight.
Risks associated with stock trading
Stock trading can be highly rewarding, but it also comes with significant risks compared to lower-risk instruments like government bonds. Investors should be aware of the following common risks before entering the market.
Market risk, also known as systematic risk, arises because stock markets are influenced by global and local economic conditions. They can be volatile and unpredictable, often shifting due to politics, macroeconomic factors, or social events.
Global risk comes from the interconnected nature of markets. Disruptions in one major exchange can ripple across others, meaning events abroad may affect your holdings even if they’re in a different region.
Interest rate risk is tied to central bank policies. For example, because of the USD/HKD peg, changes in US interest rates directly influence Hong Kong stocks, often aligning their movements.
Business risk relates to challenges within individual companies. Poor management, heavy competition, or industry downturns can cut revenues or even push a company toward bankruptcy.
Corporate governance risk appears when companies make poor decisions that damage shareholder value, such as overpaying for acquisitions or mismanaging resources. Regulators usually only step in if rules are broken, not for bad judgment calls.
Liquidity risk affects smaller-cap stocks that may not have enough buyers and sellers. This can make it harder, or more expensive, to sell when you want to exit a position.
Suspension risk occurs when exchanges halt trading in a stock to prevent unfair practices like insider trading. During suspensions you cannot buy or sell, but the stock’s price may still shift based on market or business factors.
Policy risk comes from government regulations or industry-specific policy changes, which can have a deep impact on certain companies.
While stock trading risks cannot be eliminated completely, they can be managed. Align your exposure with your financial goals and tolerance. Decide in advance how much you are willing to invest and potentially lose. Focus on companies with a record of sustainable profits, and be cautious with stocks driven purely by hype or speculation. If the rumors prove false, the reversal can be sharp and costly.
Some additional considerations – researching Stocks, trade orders, trade costs, taxes
If you are just starting out in the stock market, jumping straight into picking individual stocks may not be the best first step. Choosing the right stocks requires a deep analysis of financial ratios and an understanding of how a company performs compared to its competitors. A simpler entry point could be exchange-traded funds (ETFs). These let you invest in a group of stocks at once, reducing the risk tied to a single company. Among the many types of ETFs, those that replicate major stock market indices such as the S&P 500 are often the most beginner-friendly, since they provide broad exposure to the overall market.
When it comes to buying and selling, the way you place your orders matters. Market orders are the simplest — they execute immediately at the best available price. Limit orders give you more control by letting you set a specific price at which you want to buy or sell. They may not execute right away, but they help you avoid paying more or selling for less than you intended. Once you own a stock or ETF, you can also use a trailing stop order. This type of order lets you hold onto your investment while the price is rising, but it automatically sells if the price drops beyond a set level.
There are also some practical considerations to keep in mind. Trading costs, for example, can add up. Most often, these come in the form of commission fees charged by your broker. Many modern brokers now offer commission-free trading, but it’s still worth comparing platforms. For ETFs, you should also check the expense ratio — this is an annual fee expressed as a percentage of your investment, paid to the fund manager. For example, with an expense ratio of 0.2%, you would pay $0.20 each year for every $100 you invest.
Finally, don’t forget about taxes. If you actively trade stocks and make a profit, your earnings are subject to capital gains tax. In most cases, gains from assets held for less than a year are taxed at higher rates than long-term holdings. This structure is designed to encourage longer-term investing, which tends to be less risky and more stable over time.
Conclusion
The stock market carries a significant level of risk, but when approached with the right mindset and strategies, it can also be a powerful tool for building long-term value. This guide has outlined some of the essential aspects of trading and the market itself, but true success requires more than just surface knowledge. To grow as a trader, you’ll need to invest in quality educational resources and continually refine your skills.
One of the safest ways to put your learning into practice is by opening a free demo account with an online broker. A demo account allows you to trade with virtual credits, giving you the opportunity to test strategies and build confidence without the risk of losing real money. Once you’ve gained enough experience and developed a solid approach, you can make the transition to a live account and begin trading in real markets with greater confidence.