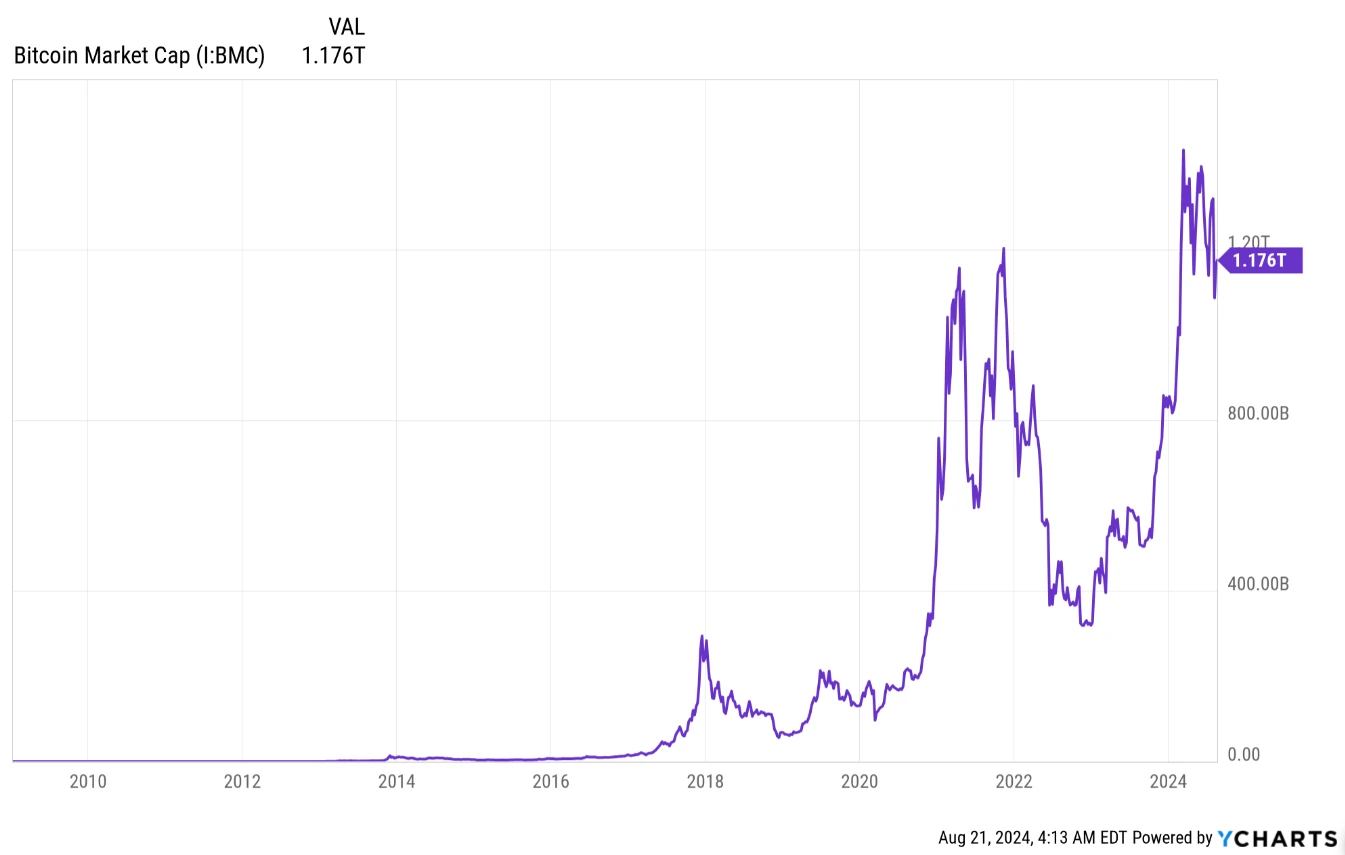
The era when mainstream media, retail investors, and financial regulators dismissed Bitcoin as a joke is long gone. By April 2025, Bitcoin had reached a market capitalization of $1.84 trillion — a figure that only a handful of stocks have achieved — making it impossible to ignore. Its notorious volatility, once considered a drawback due to double-digit percentage swings in a single day, has become a major draw for both investors and the media. Tales of sudden Bitcoin millionaires and billionaires continue to fuel the excitement.
As the first cryptocurrency to enter the market, Bitcoin has matured and become more stable compared to newer digital coins like Dogecoin and Shiba Inu. Yet, it still maintains enough volatility to attract day traders and swing traders seeking rapid profits.
While there is no shortage of online information about Bitcoin and the broader crypto market, what traders really need is a focused, in-depth guide. In this guide, we cover everything you need to know about Bitcoin, including what it is and the different strategies available for trading it.
What is Bitcoin?
Bitcoin is a cryptocurrency — a type of digital currency secured through cryptography and maintained on a decentralized peer-to-peer blockchain network. It was the first cryptocurrency to be created. Bitcoin can be transferred directly between users without involving a middle-man, meaning it operates independently of any central bank or authority.
Bitcoins are stored in digital wallets. Each wallet contains a public address, which can be shared to receive bitcoins, and a private key, which acts as a password to access the wallet. Users send bitcoins to one another via these public addresses, and each transaction is verified on the blockchain by miners. Miners are rewarded with newly minted bitcoins for validating transactions and maintaining the network.
Bitcoin is traded like a security and can be exchanged for fiat currencies or other cryptocurrencies through crypto exchanges. Its price relative to fiat currencies such as the USD or JPY is determined solely by supply and demand, without influence from central bank policies.
Some online merchants now accept Bitcoin as a payment method for goods and services. However, due to the extreme volatility of cryptocurrencies, most governments remain hesitant to recognize them as legal tender. Bitcoin has also faced criticism for enabling illegal transactions and for its significant electricity consumption.
A brief history of Bitcoin
On October 31, 2008, the Bitcoin whitepaper was published online by “Satoshi Nakamoto” — a pseudonym representing the individual or group that created Bitcoin. In January 2009, the Bitcoin source code was released publicly, enabling users to run nodes, mine bitcoins, and transfer them freely.
Software developer Hal Finney, who had developed the first reusable proof-of-work system in 2004, became the first recipient of Bitcoin. He installed the Bitcoin software on its release day and received 10 bitcoins from Satoshi Nakamoto on January 12, 2009. The first recorded commercial Bitcoin transaction occurred in 2010 when programmer Laszlo Hanyecz spent ₿10,000 to buy two Papa John’s pizzas.
By early 2011, Bitcoin traded at $0.30 per coin, rising later to $5.27 per coin. In June of that year, its price peaked at around $31.50 before falling to $4.77 in the subsequent months.
The Bitcoin Foundation was established in 2012 to promote the development and adoption of Bitcoin. Since its inception, Bitcoin has experienced extreme volatility, driven both by government crackdowns and scrutiny, as well as by statements from influential figures on social media.
By 2017, the number of cryptocurrency wallets in circulation had surpassed 5.8 million, with the majority of these being Bitcoin wallets. A significant milestone during that year was the implementation of SegWit (Segregated Witness) in August, which was a major protocol upgrade designed to improve scalability, reduce transaction malleability, and lay the foundation for the Lightning Network. While SegWit aimed to make transactions more efficient, it was not universally accepted within the Bitcoin community. Many supporters of larger block sizes opposed the change, arguing that bigger blocks were a more effective solution to scalability concerns. This disagreement ultimately resulted in a contentious split in the blockchain, leading to a hard fork that produced alternative cryptocurrencies such as Bitcoin Cash and Bitcoin Gold, both of which emerged from the divergence in vision about Bitcoin’s future.
Bitcoin rose to an all-time high of $19,783.06 by December 2017, but with China banning its use, the price declined significantly in 2018 and 2019.
The year 2020 marked a turning point for Bitcoin as the global Covid-19 pandemic and subsequent lockdowns drove institutional investors to explore cryptocurrencies as alternative assets. MicroStrategy made headlines when it purchased approximately $250 million worth of Bitcoin to hold as a treasury reserve and hedge against inflation. Soon after, Massachusetts Mutual Life Insurance Company revealed it had invested $100 million in Bitcoin, while Block, Inc. (formerly Square, Inc.) allocated about 1% of its total assets — around $50 million — into the cryptocurrency. PayPal also joined the momentum by adding Bitcoin to its platform for U.S. users, giving millions of retail investors easier access to the asset.
These developments fueled a strong rally in late 2020, and by the end of November, Bitcoin had surpassed its December 2017 peak. The momentum carried into 2021, with Elon Musk’s tweet in January sending Bitcoin above $37,000. In February, Tesla announced it had purchased $1.5 billion worth of Bitcoin and intended to accept it as payment for its vehicles. That announcement pushed Bitcoin to a then all-time high of over $64,000 in April 2021. However, Tesla later suspended the payment option in May, citing environmental concerns over Bitcoin mining’s carbon footprint, which triggered a steep correction in prices.
In June 2021, El Salvador’s parliament voted to make Bitcoin legal tender, with the law officially going into effect on September 7. That same month, the Bitcoin community also approved Taproot, a significant upgrade to the network that improved privacy and smart contract functionality, which was activated in November 2021. Meanwhile, the U.S. SEC approved the first Bitcoin futures ETF — the ProShares Bitcoin Strategy ETF — in October, with the product gaining 5% on its first day of trading.
Despite these milestones, 2022 brought turbulence. In May, the collapse of rival blockchain Terra and its native token LUNA sent shockwaves through the entire crypto market. Bitcoin’s value plunged by more than 60% from its November 2021 high, bottoming out near $26,000. Yet, in classic fashion, Bitcoin once again proved resilient.
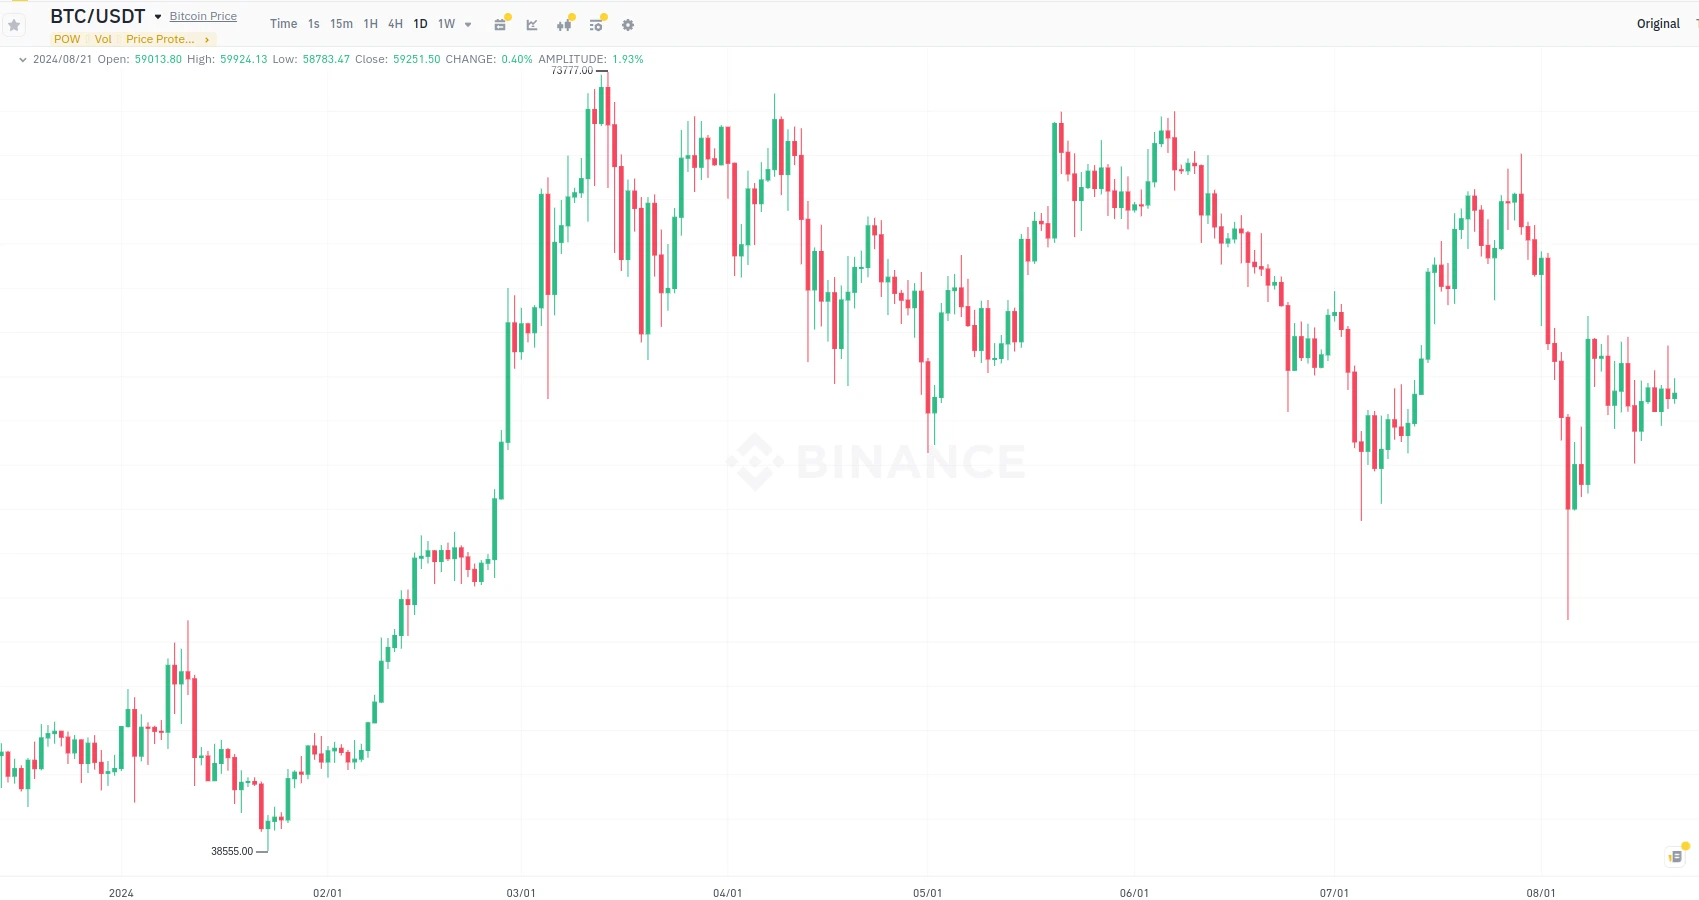
By January 2024, Bitcoin reached another landmark when the SEC approved the first spot Bitcoin ETFs in the United States, a long-anticipated event that fueled optimism among both retail and institutional investors. The market reaction was swift, and by March 2024, Bitcoin surged to a new all-time high above $73,000. One month later, in April 2024, the fourth Bitcoin halving event took place, cutting mining rewards in half and further tightening supply. Coupled with the rising influence of spot ETFs, Bitcoin experienced another sharp rally, surpassing $90,000 by April 2025. The success of these ETFs not only cemented Bitcoin’s status as a mainstream financial asset but also sparked broader conversations about the potential approval of similar exchange-traded products for other cryptocurrencies, pointing toward a new era in regulated digital asset investment.
Uses of Bitcoin
Bitcoin is a digital currency that operates independently, without being regulated or controlled by any government, bank, or central authority. This unique characteristic alone makes it highly valuable and practical in various situations, as you will soon discover.
Although Bitcoin can be used in multiple ways, some of its most common and widely recognized applications include the following:
The size of the Bitcoin market
Bitcoin’s Market Position – According to TradingView, the global cryptocurrency market is valued at approximately $2.85 trillion, with Bitcoin accounting for nearly half of this total. Bitcoin’s dominance has strengthened notably, rising by more than 15 percentage points since April 2024, when its market share was about 48 percent. This increase reflects the growing investor interest not only in Bitcoin but also in tokens, non-fungible tokens (NFTs), decentralized finance (DeFi), and blockchain-based gaming.
In April 2025, Bitcoin reached a new all-time high when its price exceeded $94,000. As of April 24, 2025, it is trading at around $93,017, with roughly 19.86 million coins in circulation. This places Bitcoin’s market capitalization at approximately $1.84 trillion, a valuation that now surpasses the market value of several leading US technology companies, including Meta (formerly known as Facebook) and Tesla.
The market dominance of Bitcoin is hovering around 64.41% at the time of writing this guide, according to data pulled from TradingView.
How to participate in the Bitcoin market
Basically, there are two main ways to gain exposure to the Bitcoin market:
What is Bitcoin investing?
Bitcoin investing, often referred to as HODLing (Holding on for Dear Life), means buying Bitcoin and holding it for the long term with the expectation of significant price appreciation over time. This strategy is different from Bitcoin trading, where the goal is to profit from short-term price movements.
Like with any other asset, Bitcoin investing requires patience and the discipline to ignore short-term fluctuations. An investor buys with the hope that the price will rise in the future, but must also accept that it may drop significantly along the way. Bitcoin’s volatility is extreme—its price can fall by 50% or more within months. For instance, in May 2022, Bitcoin lost over 60% of its value compared to its peak in November 2021.
Despite these cycles of booms and crashes, Bitcoin has historically trended upward over the long term. Investors who adopt the buy-and-hold approach expect that mainstream financial institutions will increasingly embrace Bitcoin, possibly leading to wider adoption and even its use as legal tender.
To reduce the impact of volatility, experienced investors employ techniques such as dollar-cost averaging (DCA). This involves investing a fixed amount regularly—weekly or monthly—regardless of whether the price is rising or falling. Over time, this creates an average entry price that smooths out the effects of market swings. Others prefer buying the dips, increasing their holdings whenever Bitcoin’s price drops by a set percentage, such as 30% or 50%. Both methods have proven effective for many investors.
On the other hand, some newcomers mistakenly treat Bitcoin as a get-rich-quick scheme. In reality, success with Bitcoin investing usually requires a long-term outlook, much like investing in stocks or real estate. Since nothing is guaranteed, it is generally wise to invest only disposable income—money that is not needed for daily expenses or essential bills.
Advantages and Disadvantages of Bitcoin investing
There are many advantages of participating in the Bitcoin market. When planned well and done with utmost caution, it can be highly rewarding. Compared to short-term trading, HODLing offers the following benefits:
What is Bitcoin trading?
While investing may suit those who prefer a long-term approach, it may not appeal to individuals with a high appetite for fast profits or those who thrive on the excitement of short-term price movements. For such people, short-term trading offers the chance to feel the pulse of the market.
Bitcoin trading involves frequently buying and selling coins in order to profit from short-term price fluctuations. Trading in itself is fast-paced, but Bitcoin’s volatility makes it even more intense. The cryptocurrency market never closes — Bitcoin trades around the clock, 24 hours a day and 7 days a week — which means that scalpers and day traders always have opportunities to act.
The objective of any Bitcoin trader is simple: buy low and sell high. For example, imagine a trader buys 10 bitcoins at $92,700 per coin, spending $927,000 in total. If the price rises to $93,400 and the trader sells all 10 coins, they would receive $934,000, making a net profit of $7,000.
However, Bitcoin’s price movements are often erratic and difficult to predict. While some argue that Bitcoin is easier to trade than traditional securities, history shows that HODLers (long-term holders) have generally outperformed traders over Bitcoin’s 16 years of existence. Successfully timing the market is a daunting challenge.
Still, Bitcoin remains highly sensitive to news and social media sentiment. Tweets from influential figures, regulatory announcements, or major financial events can send prices soaring or crashing within hours. For traders, staying updated on global events and online chatter is crucial.
Most cryptocurrency exchanges allow access to both spot Bitcoin and derivatives such as futures and options. Spot traders simply buy and sell the actual coin, without leverage. Derivatives traders, however, can use leverage — borrowing funds to control larger positions with a smaller initial investment. While leverage can magnify gains, it also multiplies losses, making leveraged Bitcoin trading significantly riskier than long-term investing.
Bitcoin trading vs. investing: which is better?
Types of Bitcoin markets
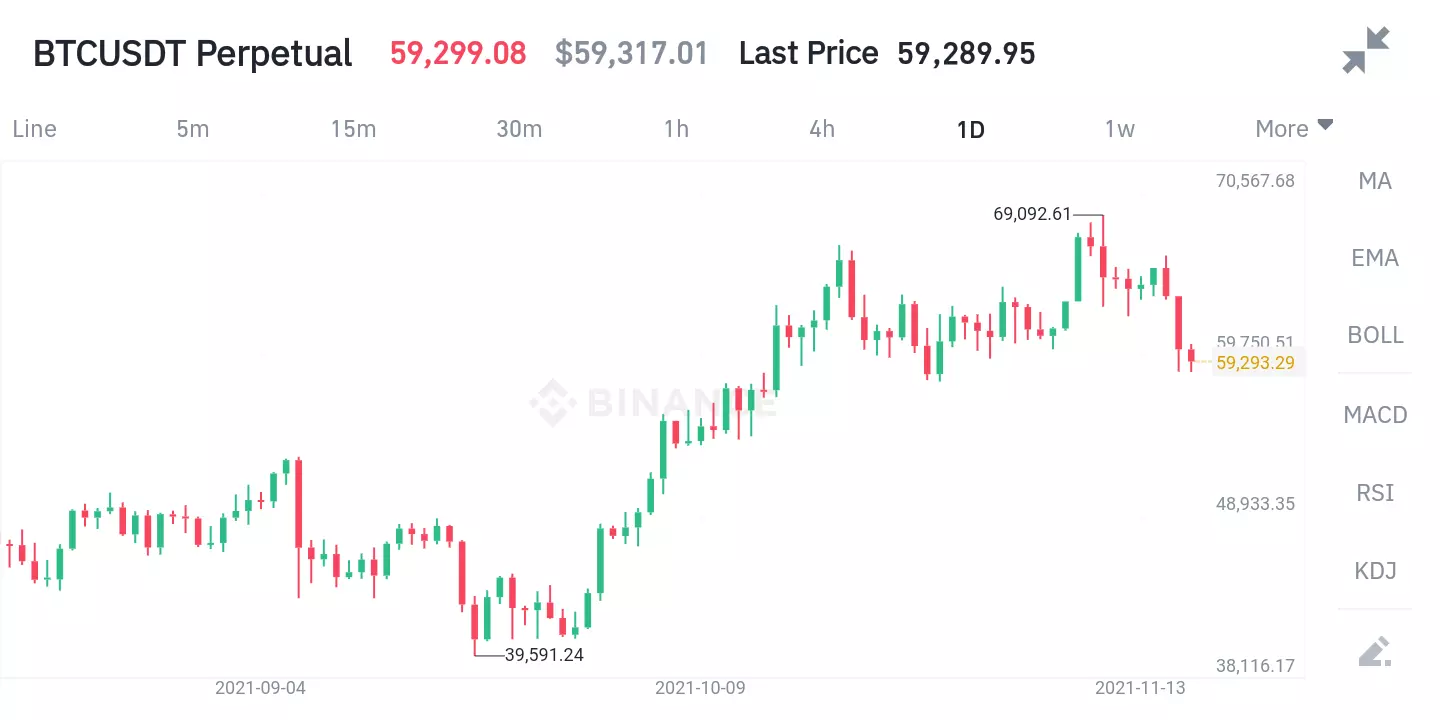
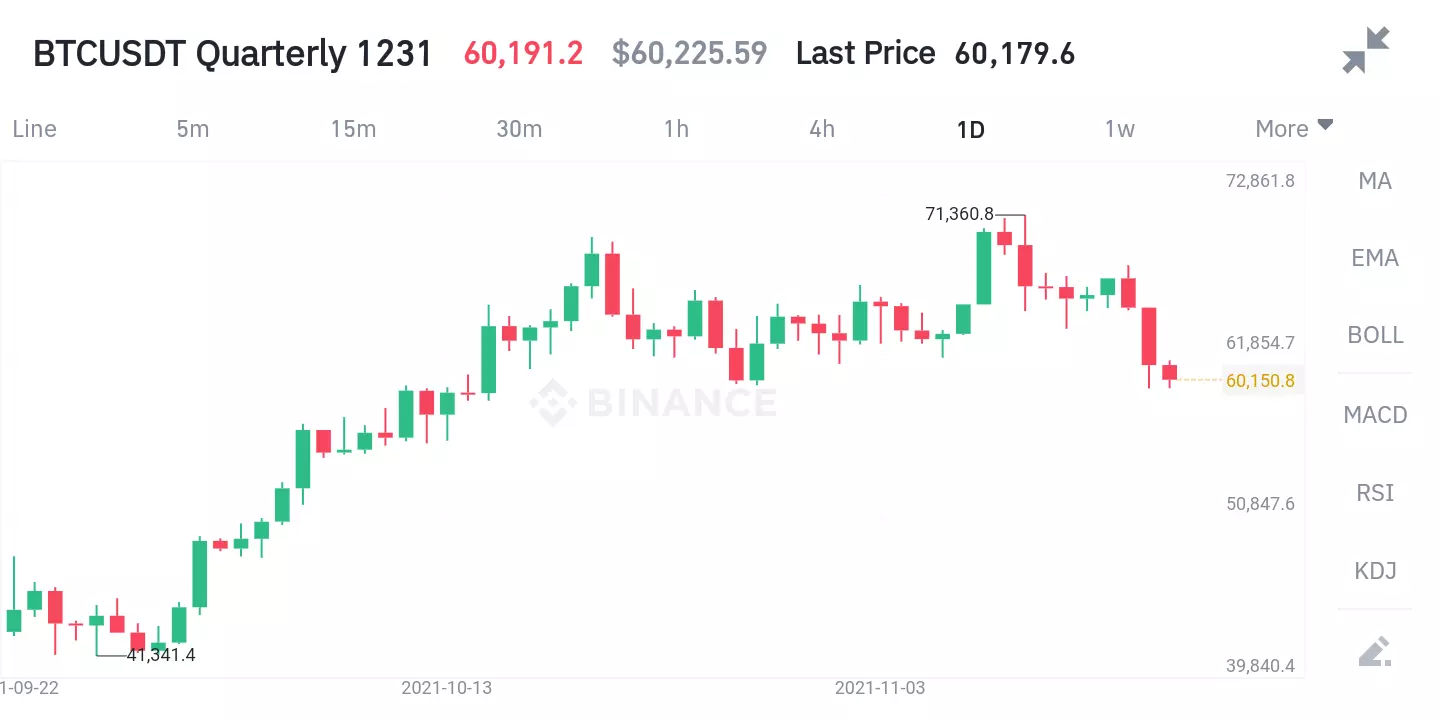
The spot market is the simplest and most common choice for beginners. Here, you buy and sell Bitcoin at its current market price, taking immediate ownership of the asset. The futures market, on the other hand, allows you to speculate on the future price of Bitcoin without necessarily owning it. Futures are divided into perpetual contracts, which have no expiry date, and quarterly contracts, which settle after three months. Lastly, the options market gives traders the right, but not the obligation, to buy or sell Bitcoin at a predetermined price within a set timeframe, offering more flexibility but also requiring a deeper understanding of derivatives.
Bitcoin spot market
In contrast, the futures market does not involve immediate delivery of Bitcoin. Instead, you agree to buy or sell Bitcoin at a future date for a predetermined price. This allows traders to speculate on whether the price will rise or fall. Futures trading often involves leverage, meaning you can open larger positions than the funds you hold, but this also increases the level of risk.
The options market works differently. It gives you the right, but not the obligation, to buy or sell Bitcoin at a specific price before a set expiration date. While options can be useful for hedging against price fluctuations, they are more complex and are usually preferred by experienced traders.
The Bitcoin spot market is highly liquid, which means exchanges match orders immediately and trades are settled at once. This is the simplest form of Bitcoin trading and involves directly purchasing coins at current market prices. Exchanges act as intermediaries, matching buyers and sellers through bid and ask orders. You can also buy cryptocurrencies like Bitcoin on the spot using fiat currencies.
When you buy Bitcoin at its current price, your goal is usually to profit if its value appreciates. If the asset rises, the value of your holdings increases proportionally; if the asset falls, your holdings decrease in the same proportion. In traditional spot trading without leverage, you only realize a loss when you sell, and your holdings cannot be wiped out unless Bitcoin becomes completely worthless.
For example, suppose you place a buy limit order for 5 Bitcoins at $91,000 per coin. If the market drops to that price, your order will be executed, and you will own 5 Bitcoins in your spot wallet. If the Bitcoin price then rises 2% to $92,900, the value of your holdings also increases by 2%. Conversely, if the price falls 3.3% to $88,000, the value of your holdings decreases by 3.3%. However, you only incur that loss if you sell at that point. By holding onto your Bitcoins, you have the chance to recover losses if the price rebounds. Importantly, your account will never face a margin call or liquidation in standard spot trading. The only way to lose everything is if Bitcoin loses 100% of its value or your account is compromised.
Spot trading typically involves using your own capital, though some exchanges allow limited margin trading with leverage. Keep in mind that leverage ratios in spot markets are generally low, and commissions can be higher compared to other forms of trading.
Both traders and investors use the spot market. Traders often open and close multiple positions in search of quick profits, while investors accumulate positions gradually over time. Trading may offer more frequent profit opportunities, but the higher number of transactions also leads to increased costs.
Key features of the spot market
Strategies for trading the spot market
There are different strategies for trading the spot market but none is the Holy Grail. The crypto markets are full of uncertainties, and price movements tend to be erratic most of the time. Nonetheless, below are the two most common approaches applicable to trading Bitcoin on the spot market.
Buying the dip
This strategy refers to purchasing Bitcoin when its price experiences a significant decline or correction. The idea behind this approach is to take advantage of temporary price drops and enter the market at a relatively cheaper level. Instead of chasing an upward rally and buying when prices are already high, buying the dip allows traders to position themselves at what may be considered a fair or discounted value. When applied correctly, this method can generate strong returns, as it enables traders to benefit from the recovery phase that often follows such pullbacks.
Both traders and investors use this method. But traders often use many indicators to determine where and when the pullback would reverse so as to get a better entry price.
So how do you buy the dip?
Many beginner traders fall into the trap of buying every time Bitcoin’s price dips, assuming it will always bounce back. However, not every dip is a good entry point. There is no strict rule for identifying the perfect dip to buy, but a few guidelines can help improve decision-making.
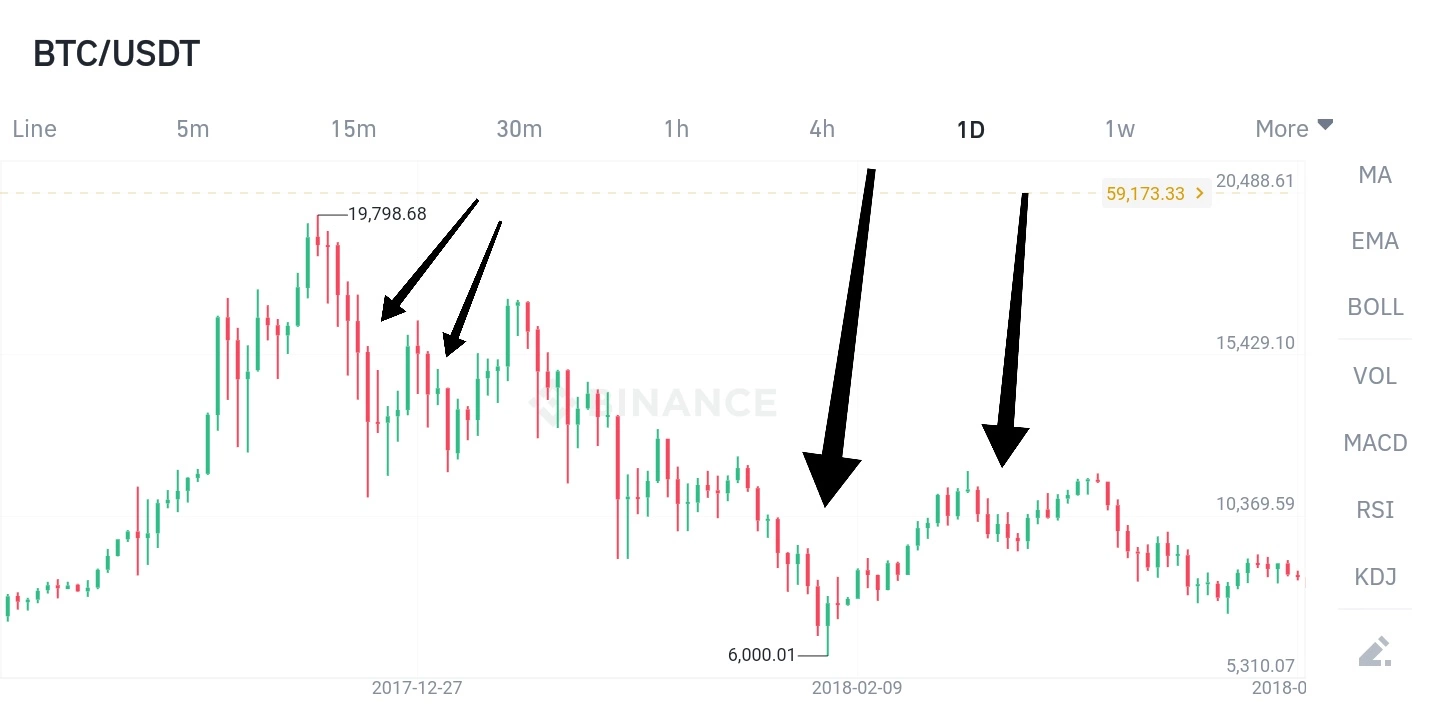
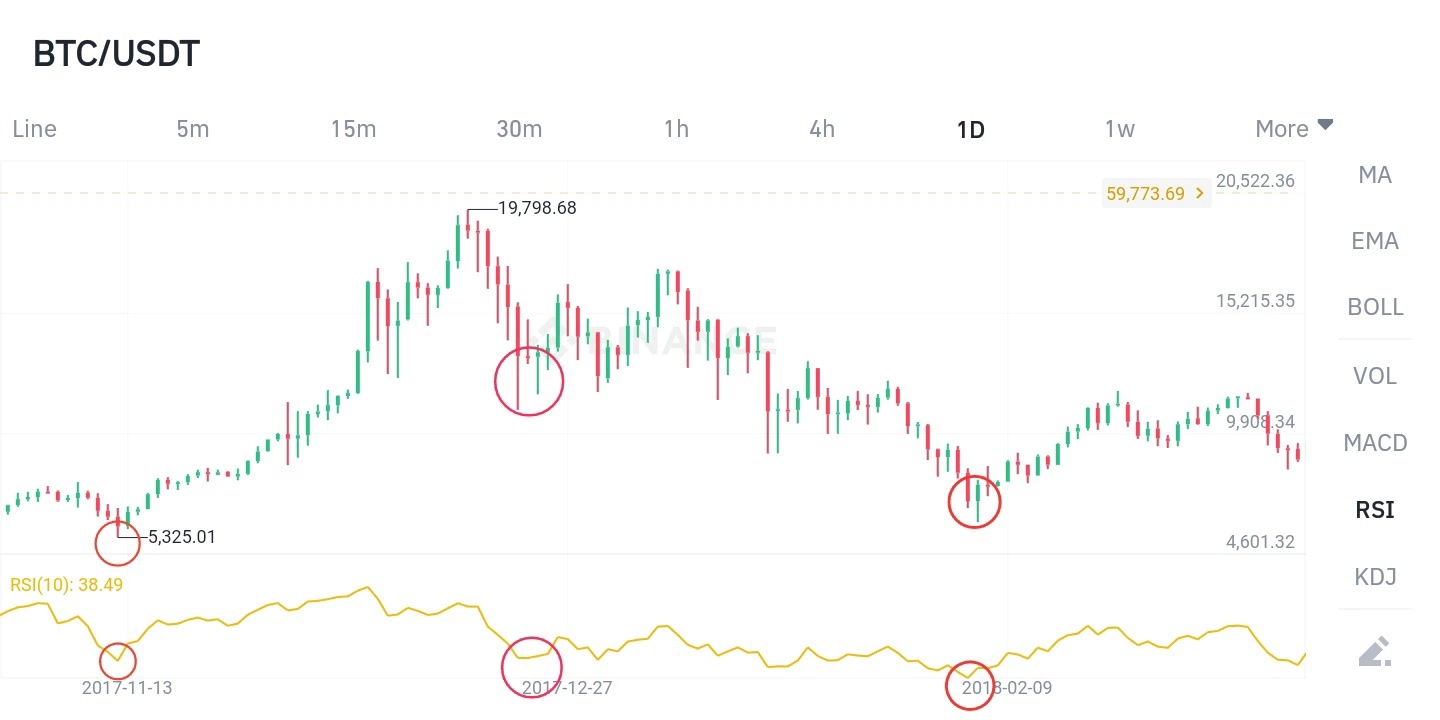
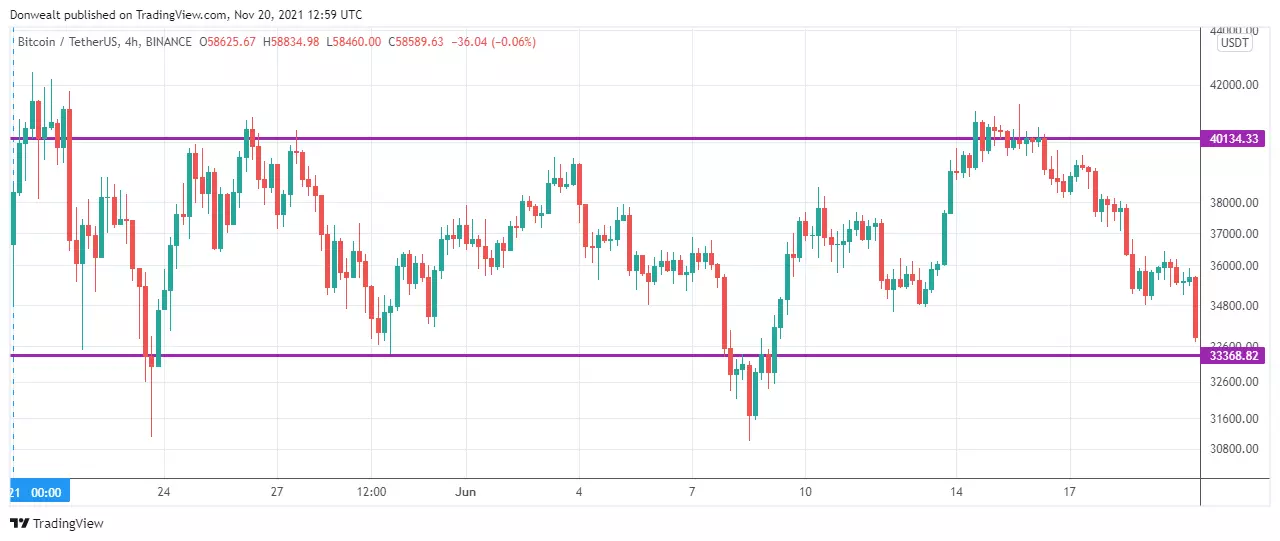
The first step is to figure out whether the dip is just a short-term pullback within an ongoing trend or the beginning of a full trend reversal. Typically, in a healthy market pullback, the price does not fall below the level of the previous pullback. On the other hand, a trend reversal is usually confirmed when the market forms a lower low followed by a lower high, signaling weakness.
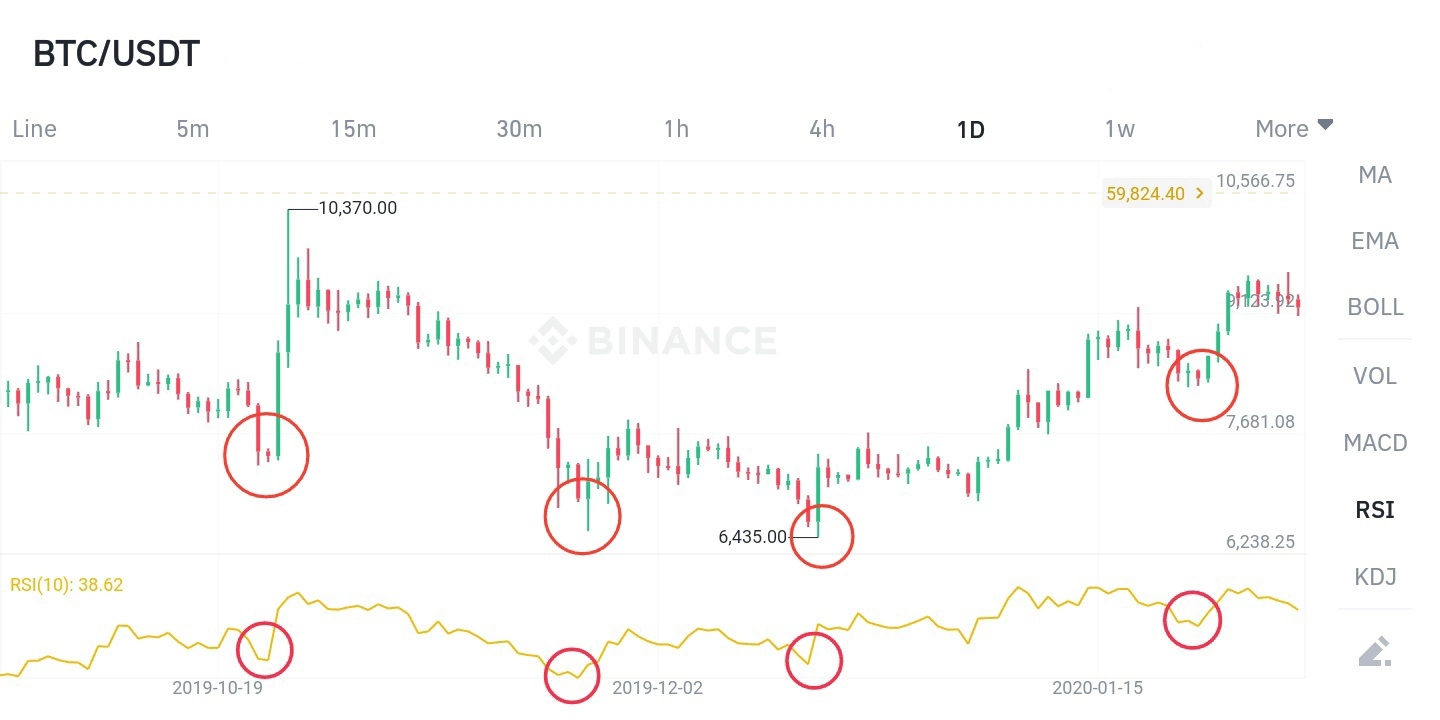
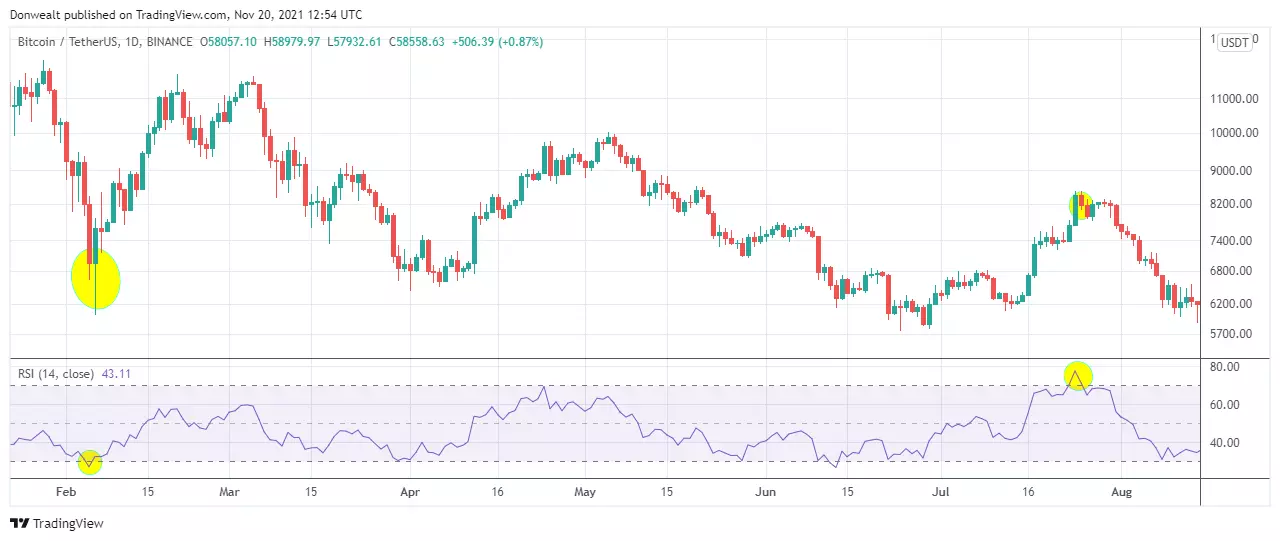
To avoid mistaking a bearish trend for a normal pullback, traders can rely on technical indicators to confirm their analysis. Tools such as the Relative Strength Index (RSI) can highlight extreme conditions in the market, helping to identify whether Bitcoin is oversold (a potential buying opportunity) or overbought (a potential warning).
The charts above are Bitcoin daily charts that include the relative strength index (RSI) indicator. The ellipses marked on the charts highlight instances where Bitcoin’s price dipped while the RSI showed extreme readings. Many traders use the RSI as a signal to buy when it falls below 30, which is considered an oversold condition. However, since indicators are based on historical data, caution is required when relying solely on them for making decisions.
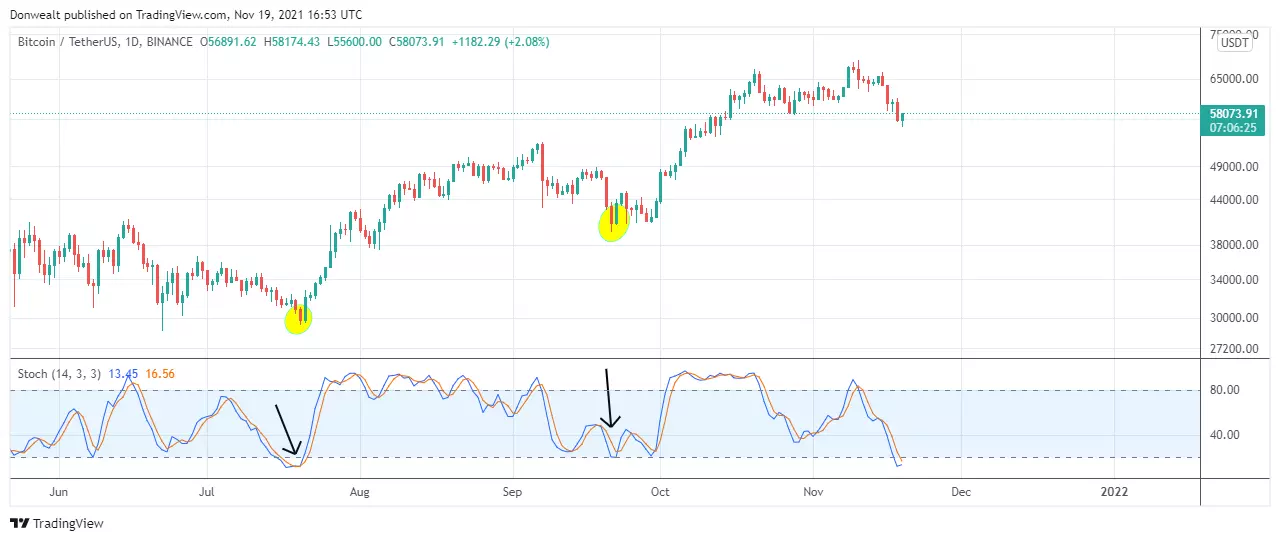
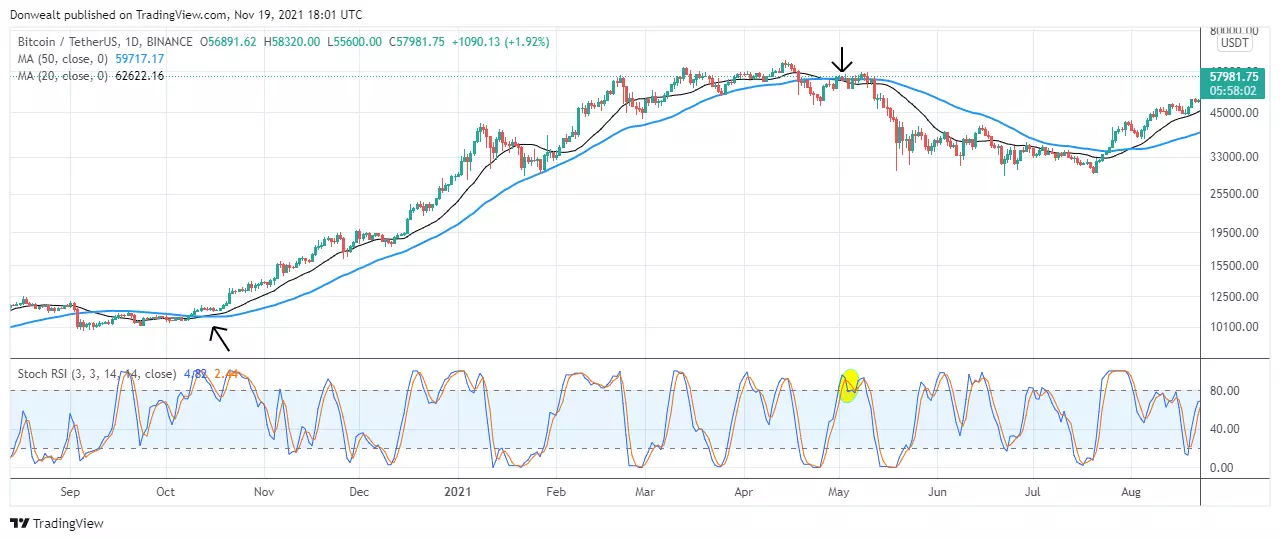
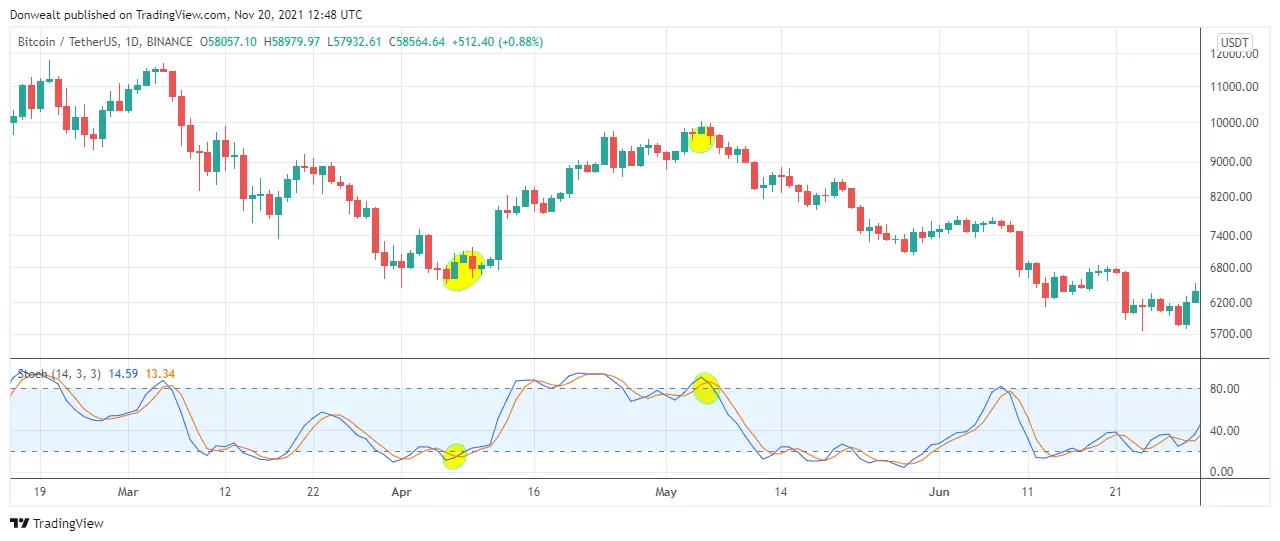
The next chart illustrates the stochastic indicator. You can see that price dips often reversed once the stochastic entered the oversold region. This suggests that the current dip could potentially reverse again if the stochastic moves into oversold territory.
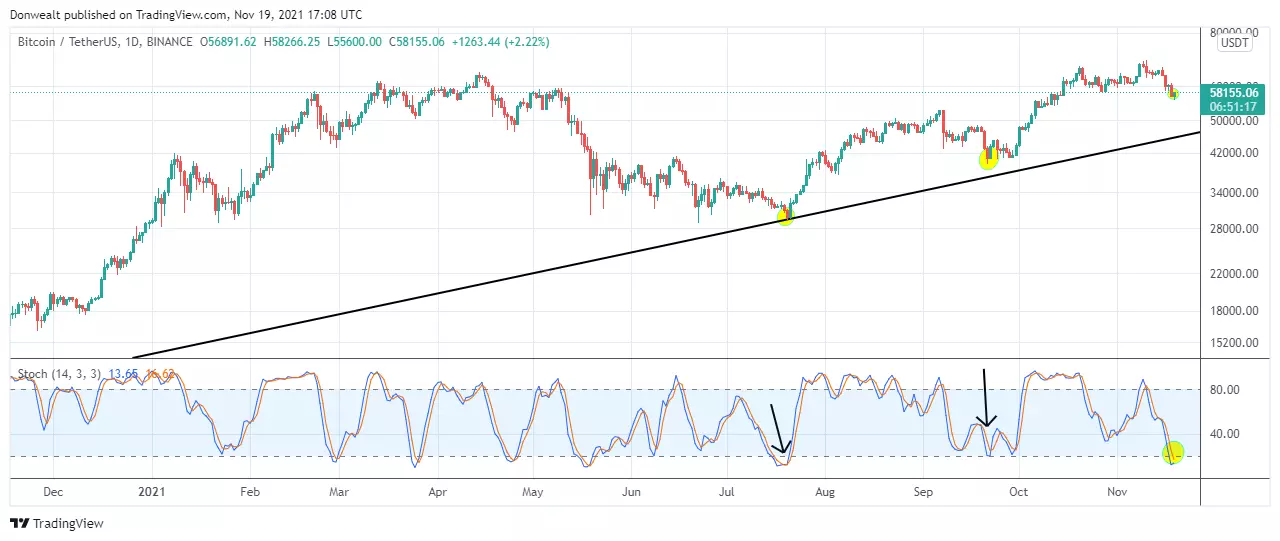
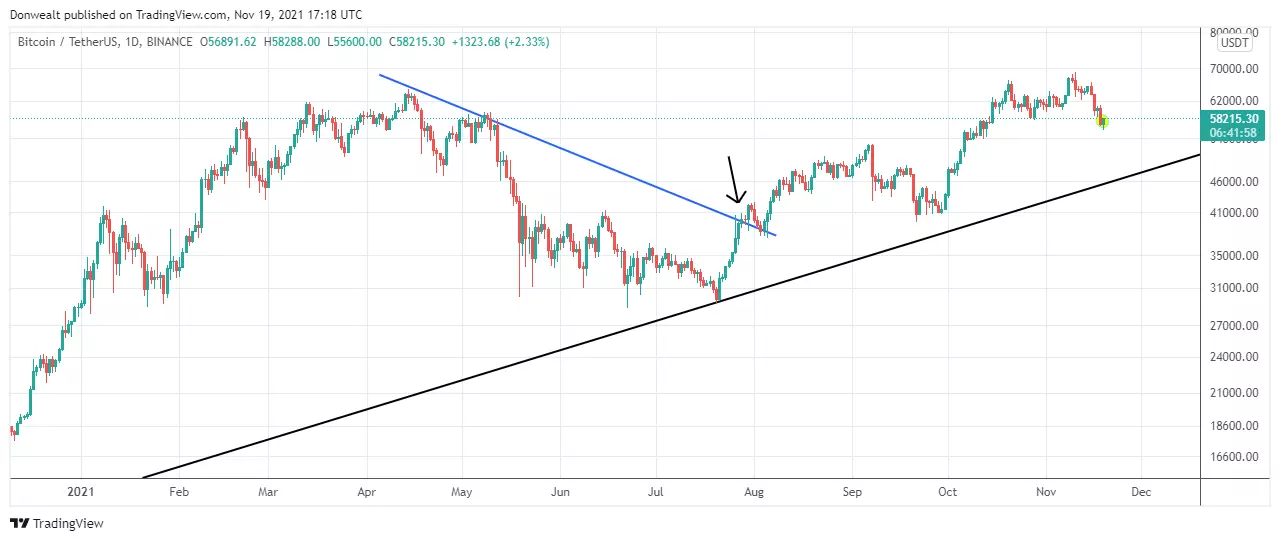
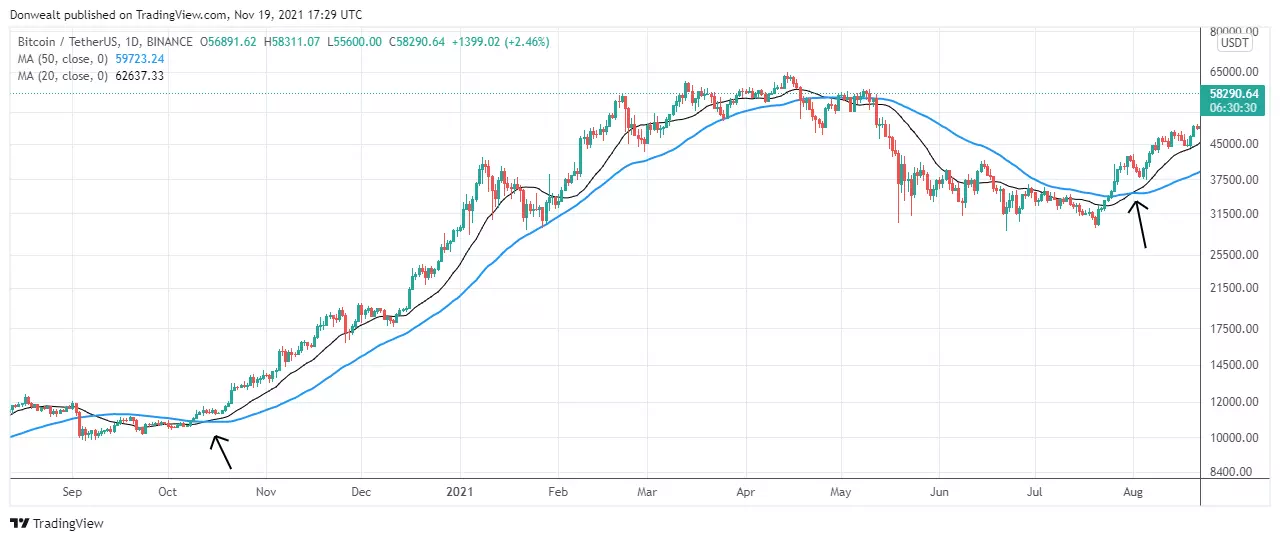
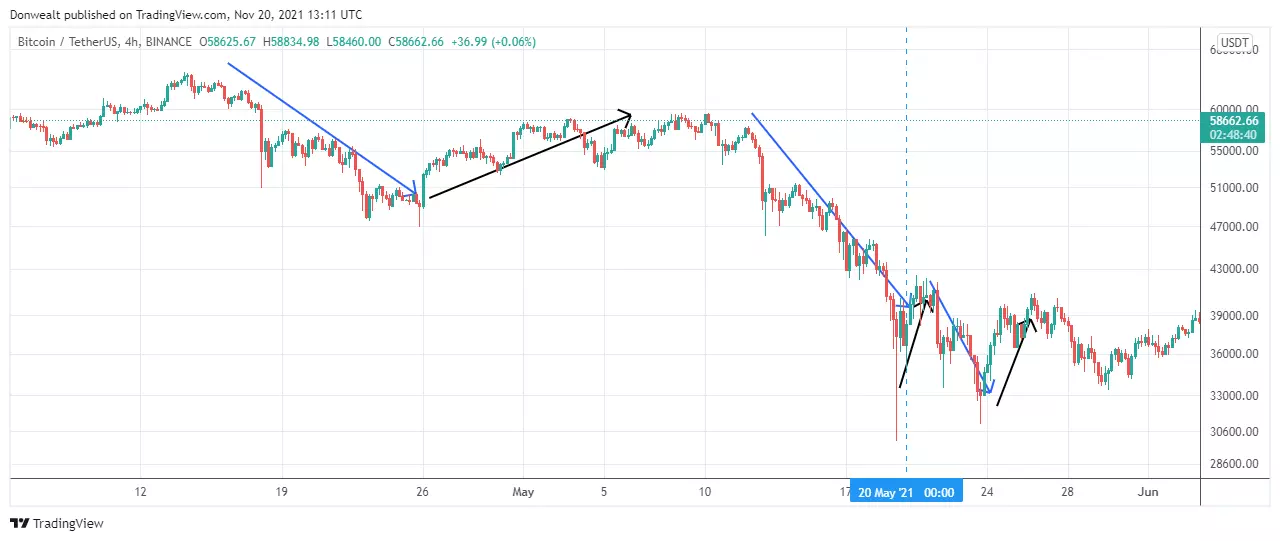
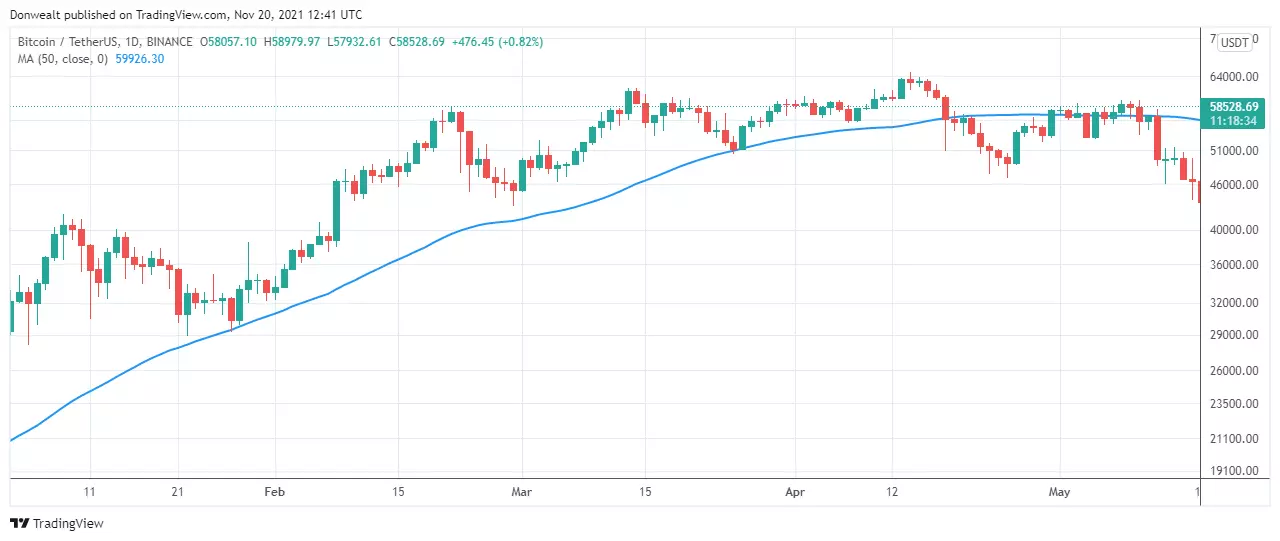
Second, you can apply trend lines or moving averages to get an idea of the trend before using the momentum indicators or oscillators to track the dips. See the chart below.
Selling the pump
So what indicators can you use?
Traders often rely on a variety of tools to identify when the market may be reaching a top, though it’s important to remember that no method is flawless. Some of the most commonly used indicators for spotting these levels include moving averages, the relative strength index (RSI), and Bollinger Bands. Beyond indicators, traders also make use of price action tools such as candlestick formations, chart patterns, market structure analysis, and trend lines to anticipate potential reversals.
It’s generally unwise to depend on a single indicator in isolation, as this can lead to misleading signals. Instead, combining two or three indicators that complement one another tends to provide stronger confirmation. For example, pairing moving averages with the relative strength index can give more reliable signals. In the chart below, you can see how these tools highlight market tops and suggest favorable points to lock in profits.
The chart above illustrates a moving average dead cross, where the shorter-term 20-period moving average crosses below the longer-term 50-period moving average. This crossover often signals a potential trend reversal and highlights the possibility of a market top forming. Supporting this signal, the stochastic RSI below the chart shows overbought conditions (above 80), which further strengthens the case for a corrective move. For short-term traders, this confluence may serve as a cue to sell and lock in profits.
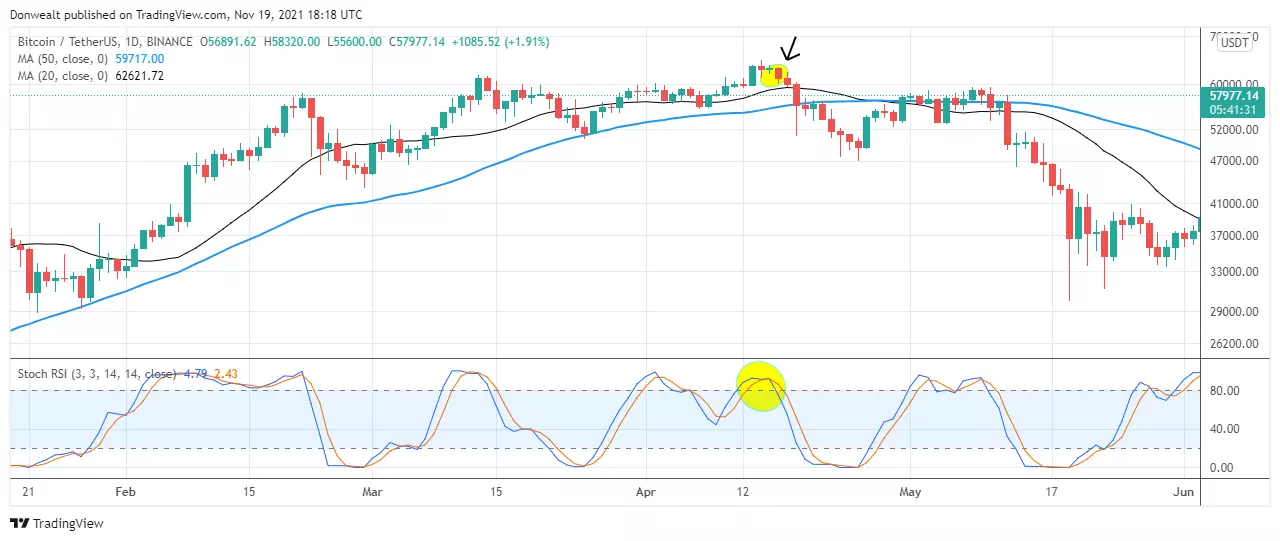
Another effective approach to spotting potential market tops is by watching for candlestick reversal patterns. A classic example is the bearish engulfing pattern, where a large bearish candlestick completely engulfs the prior bullish candlestick. This pattern reflects a strong shift in momentum from buyers to sellers and often appears near market tops. In the chart below, you can see how this pattern provides an early warning of a possible downside move.
Notice that the moving average dead cross had not yet occurred when the bearish engulfing candlestick pattern appeared. Even so, the combination of the engulfing pattern (black arrow) and the overbought condition signaled by the stochastic-RSI (ellipse) was sufficient to suggest a potential market top and an opportunity to take profit.
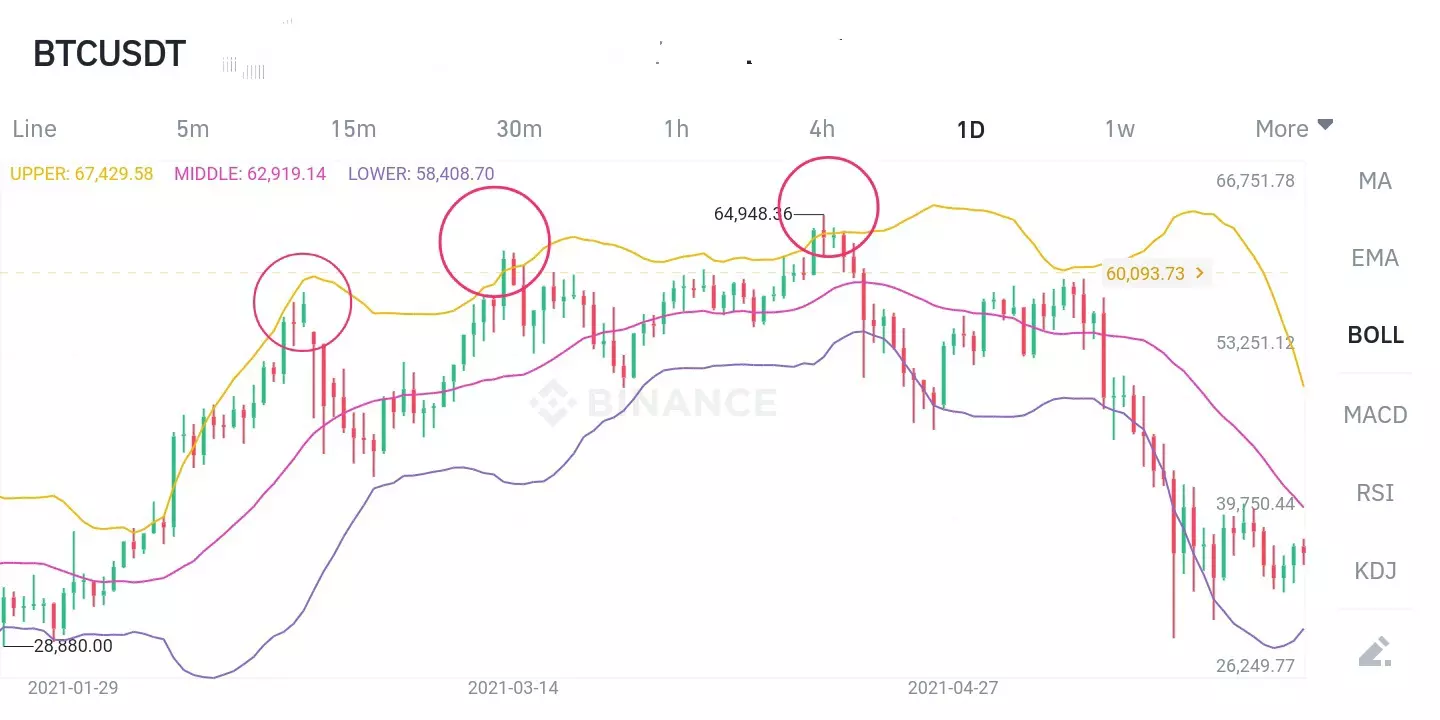
In addition to these signals, Bollinger Bands can also provide valuable insight into potential tops. The indicator consists of two outer bands (set two standard deviations away from the mean) and a middle line, which is the 20-period moving average. The bands expand and contract based on market volatility. When price repeatedly tests or rides along the upper band, it often suggests the market is overextended and may be preparing for a retracement. See the chart below for an example.
As you can see, indicators can be very helpful when trading the Bitcoin spot market. Having said that, let’s take a look at the pros and cons of trading the spot market. See the table below.
If you want to improve your profit potential and can handle huge risks, you may want to consider Bitcoin futures, which we explain in the next section.
Bitcoin futures market
The futures market allows traders to speculate on the future price of an asset without actually owning it. In the case of Bitcoin, futures contracts let traders buy or sell based on the expected price of Bitcoin at a later date. For a trade to occur, there must be at least two participants: one taking the long side (buying) and the other taking the short side (selling).
For example, Jim decides to go long by buying 5 Bitcoin futures contracts at $93,000 each. On the other side, Ted goes short by selling 5 contracts at the same price. The market matches their orders, and the trade is executed. If the price rises to $94,000, Jim earns $5,000 [($94,000 – $93,000) x 5 contracts], while Ted loses $5,000 since the market moved against him.
One of the main advantages of the futures market is that traders don’t need the full contract value to open a position. Instead, they only provide a fraction of it, called the initial margin, while the exchange covers the rest through leverage. This allows traders to control larger positions than their actual capital would normally allow. In contrast, the spot market requires paying the full value of the asset upfront.
Leverage, however, is risky. While it can amplify profits when the market moves in your favor, it can also magnify losses if the market moves against you.
Crypto exchanges typically offer different leverage ratios, each with a corresponding margin requirement. These ratios are usually expressed as 1:5, 1:10, 1:20, or 1:100, meaning the higher the leverage, the lower the margin you need to open a trade. Would you like me to also simplify this further with a small table showing leverage vs. margin requirement.
Types of futures contracts
On Binance, which is the largest cryptocurrency exchange with a daily spot trading volume of $17.06 billion in late April 2025, traders can choose between two types of Bitcoin futures contracts: perpetual futures and quarterly futures.
Perpetual futures have no expiration date, allowing traders to hold positions indefinitely as long as margin requirements are met. These contracts use a funding rate mechanism to keep the price close to Bitcoin’s spot price, with payments exchanged between long and short traders every few hours.
Quarterly futures, on the other hand, have fixed expiration dates, usually every three months. At expiration, the contract is settled based on Bitcoin’s market price. These contracts do not use a funding rate, which makes them suitable for traders who want to avoid frequent funding payments and prefer a clear settlement timeline.
Perpetual futures
Perpetual futures are unique because, unlike traditional futures, they don’t expire. Instead, they use a funding rate mechanism: traders holding open positions pay or receive a funding fee (usually every 8 hours on Binance) to keep the contract aligned with the spot market price.
If the perpetual futures price is higher than the spot price, long traders pay shorts the funding fee.
If the perpetual price is lower, short traders pay longs.
This system ensures that the perpetual futures price doesn’t drift too far from the underlying Bitcoin spot market. Still, there can be small differences between the two due to liquidity, leverage, and market sentiment.
Quarterly futures
Quarterly futures are fixed-term contracts that expire every three months. On Binance, they follow a set cycle — March, June, September, and December — and always expire on the last Friday of the expiration month. Traders holding open positions do not need to manually close them; instead, Binance automatically settles the contracts at expiration. The settlement reflects the final market price, meaning that traders will realize either a profit or a loss depending on the direction of their trade relative to the market.
Key features of Bitcoin futures
The futures market gives traders the flexibility to profit in both directions — by going long (buying) when expecting prices to rise, or going short (selling) when anticipating a price drop. Just like in spot trading, futures traders rely on technical analysis, indicators, or pure price action to make decisions. However, the major distinction lies in leverage: in futures, traders borrow funds to increase their position size, which amplifies both potential profits and potential losses.
Because of this, futures positions can be liquidated by the exchange once losses reach a certain threshold, ensuring the borrowed funds are protected. This is very different from spot trading, where liquidation does not occur since the trader directly owns the asset (e.g., Bitcoin).
The table below outlines the key differences between Bitcoin spot and futures markets:
Bitcoin options
Another way to participate in the Bitcoin market is through options contracts. A Bitcoin options contract is a type of derivative that gives traders the right, but not the obligation, to buy or sell Bitcoin at a predetermined price within a set period of time. The key difference between options and futures contracts is that while futures require settlement at expiration, options give traders flexibility — they can choose whether or not to exercise the contract depending on market conditions.
There are basically two types of options: call and put options.
A call option is an options contract that gives the buyer the right, but not the obligation, to purchase Bitcoin at an agreed strike price. Traders typically buy call options when they expect the price of Bitcoin to rise.
A put option, on the other hand, gives the buyer the right, but not the obligation, to sell Bitcoin at an agreed strike price. Traders usually buy put options if they anticipate a price decline.
On exchanges like Binance, Bitcoin options are generally cash-settled at expiry, but traders also have the flexibility to exercise their contracts before the expiry date.
To trade options, the only upfront cost is the premium — the price paid to purchase the contract. Unlike futures trading, where a sufficient margin must be maintained to keep positions open, an options contract remains valid until expiry or until the trader exercises their right. The maximum loss is limited to the premium paid.
Expiry times for contracts vary across exchanges, typically ranging from as short as 1 minute to as long as 24 hours. However, traders should keep in mind that options lose value over time due to time decay — as the expiry approaches, the contract’s value gradually declines until it reaches zero at expiration.
Volume options
Volume options contracts don’t focus on the price of an asset but instead on its trading activity. With these contracts, the goal is to predict whether trading volume will rise or fall within a set period of time (the expiry). If the volume increases in the direction of your trade, you can make a profit. However, if the volume falls before the expiry date, you risk losing the premium you paid for the option.
Bitcoin options
When it comes to analyzing the Bitcoin market, traders usually rely on two main approaches: fundamental analysis and technical analysis. Fundamental analysis is often preferred by long-term investors who want to evaluate Bitcoin’s overall value and potential. Technical analysis, on the other hand, is commonly used by short-term traders who focus on price movements and chart patterns. There is also a less common approach called seasonality analysis, which looks at recurring market trends over time.
Fundamental Analysis
Fundamental analysis looks at the outside influences that shape the value of an asset. For cryptocurrencies like Bitcoin, these external factors play an even bigger role because of how disruptive and relatively new the industry is. Developments such as new regulations from major economies including the United States, China, and the European Union can have an immediate and significant impact on cryptocurrency prices.
Information on market conditions and external drivers of crypto can often be found on platforms like Reddit, X (formerly Twitter), Telegram, and Slack, where communities discuss the latest trends. In addition, data aggregators such as CoinGecko, CryptoCompare, and CoinMarketCap provide reliable, real-time insights on Bitcoin and many other cryptocurrencies.
When carrying out fundamental analysis, some of the key factors worth paying attention to include:
Seasonality Analysis
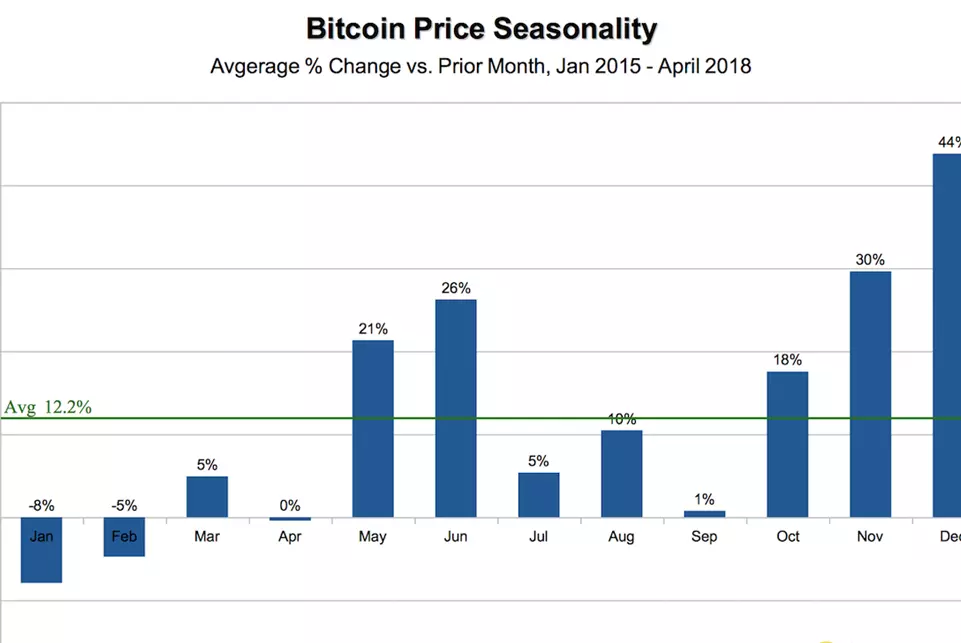
Seasonality analysis looks at how Bitcoin behaves during different times of the year. Instead of focusing on daily or weekly movements, it studies average price changes by month to identify recurring patterns. For example, analysts might examine how Bitcoin’s price typically moves in January compared to June or December. The chart below illustrates this by showing the average monthly percentage change in Bitcoin’s price over a three-year period, from 2015 to 2018.
The dataset is relatively small, so it’s difficult to draw any strong conclusions from it. Still, the chart suggests a pattern where Bitcoin generally performs better in the final quarter of the year, while the first quarter tends to be its weakest period.
Technical Analysis
Technical analysis involves using indicators, charting tools, and price action to forecast how an asset might move in the future. The idea is based on studying past price and volume data to anticipate market trends. Analysts who specialize in this approach, often called chartists, believe that all factors influencing price are already captured within the charts and trading volumes.
Some of the most widely used technical indicators include the RSI, stochastic oscillator, moving averages, and the MACD, which track both momentum and volume. Many of these tools have already been highlighted in the spot market section, and we’ll go into more detail about how they work in the following section.
How to read the Bitcoin price chart
Reading a Bitcoin price chart isn’t much different from reading the chart of any other asset. Price movements can be displayed using different chart types, though the most common are the line chart, the bar chart, and the Japanese candlestick chart.
A line chart is the simplest form, plotting a continuous line that usually represents the closing price over time. In contrast, bar charts and candlestick charts provide more detail by showing four key data points for each time interval: the opening price, the highest price, the lowest price, and the closing price.
Reading the price action
Price action simply refers to the record of how an asset’s price has moved over time, as shown on a chart. It forms the foundation of technical analysis, and some traders, often called pure chartists, rely entirely on price action without using additional indicators. The real skill lies in reading price waves and recognizing whether the market is trending or stuck in a sideways, range-bound movement.
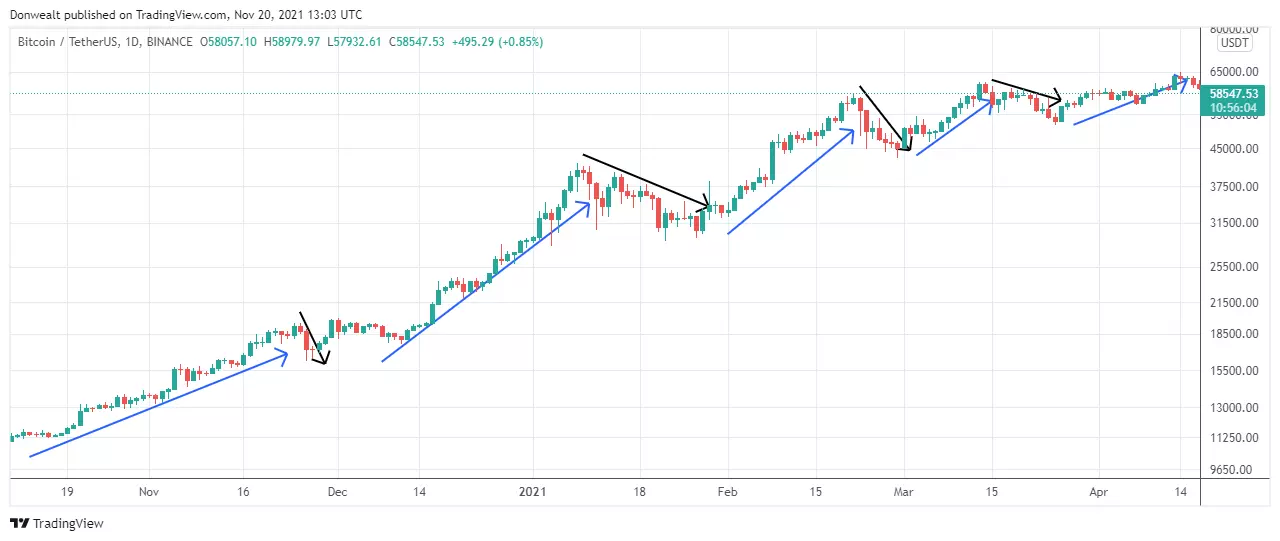
Price waves generally fall into two categories: impulse waves and corrective waves, also known as pullbacks or retracements. Impulse waves are larger and move in the direction of the main trend, while corrective waves are smaller and move against it. For example, during an uptrend, you’ll typically see higher swing highs and higher swing lows. In the chart below, the stronger upward moves (impulse waves, shown with blue arrows) contrast with the smaller downward pullbacks (retracements, marked with black arrows).
In a downtrend, the pattern shifts to lower swing lows and lower swing highs. On the chart below, you can see the larger downward moves, known as impulse waves, highlighted by the blue arrows. The smaller upward movements, which are retracements, are shown with the black arrows.
In a range-bound price action, the waves are almost of equal size, so the price moves sideways, as in the chart below.
Helpful indicators
Some indicators you can use to improve your results include the RSI, stochastic, MACD (moving average convergence/divergence), and moving averages.
The Relative Strength Index (RSI)
The Relative Strength Index (RSI) is a momentum oscillator that highlights when the market may be in extreme conditions. A value of 70 or higher usually signals that the asset is overbought, while a reading of 30 or lower suggests it is oversold.
In practice, traders often look to go long when the RSI dips into oversold territory and consider short positions when it reaches overbought levels. Still, most traders avoid relying on RSI alone, instead combining it with other indicators and price action analysis to make more reliable decisions.
Stochastic
Just like the RSI, the stochastic also measures extreme conditions in the market. A reading above 80 is overbought and considered bearish, while a reading below 20 is oversold and considered bullish.
Moving Average
A moving average is a trend-following tool that tracks the average price of an asset over a set number of periods and updates as new data comes in. It helps smooth out price fluctuations so traders can better see the overall direction of the market. Among the different types of moving averages, the two most commonly used are the simple moving average (SMA) and the exponential moving average (EMA).
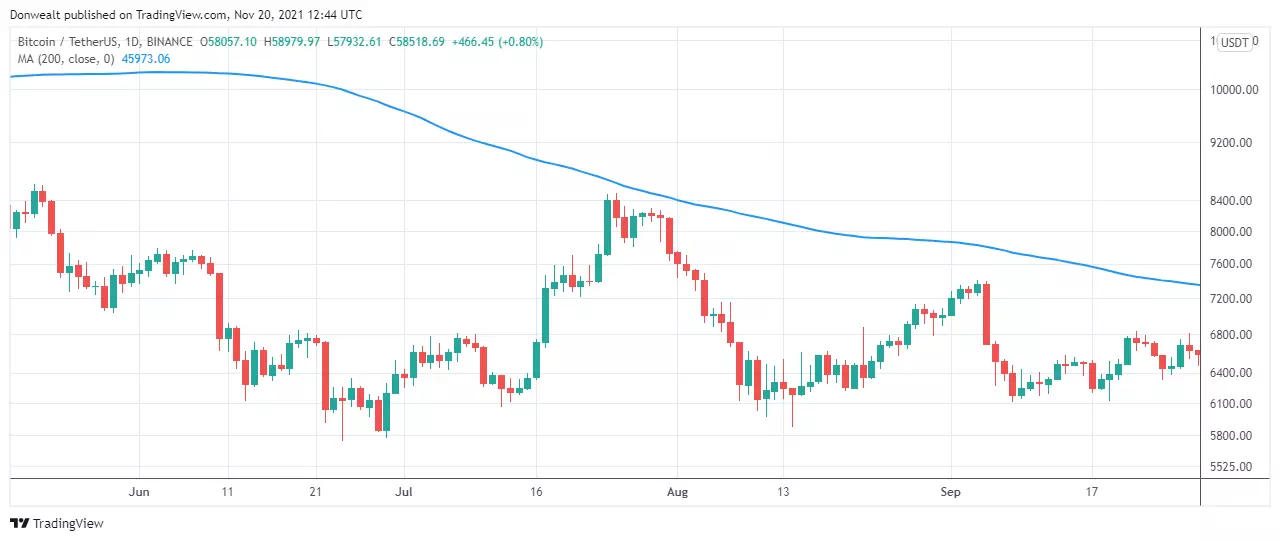
The charts above and below use a 50-day moving average as a reference point. When the price remains above the moving average for most of the time, it generally indicates an uptrend, as shown in the chart above. On the other hand, when the price mostly stays below the moving average, it points to a downtrend, as seen in the chart below.
Different Bitcoin trading styles
Generally, there are four trading styles: scalping, day trading, swing trading, and position/trend trading.
Other things you should know
Here are some other things you need to know about Bitcoin trading.
Types of trade orders
These are the common order types you can use when trading cryptos.
Position or contract sizing
Position size, also called contract size, refers to the amount of an asset a trader decides to trade. It’s not just about picking any amount and clicking buy or sell. Determining the right position size requires careful consideration of your trading capital, risk tolerance, and money management strategy.
For Bitcoin trading, position size is typically calculated using the following method:
Position Size = (Account Size x Percentage Risk per Trade) / Stop Loss (as a decimal)
Where:
Account size = your equity balance
Percentage risk per trade = the amount you are willing to risk on the trade
Stop loss = invalidation point
For example, imagine you have a trading account with $10,000 and your money management rule allows you to risk only 2% of your account on any single trade. This means the maximum amount you’re willing to risk is $200.
Next, suppose your analysis leads you to set a stop loss 5% away from your entry point. Using the position size formula, you can then calculate how large your trade should be to stay within your risk limits.
Position size = $10,000 X 0.02 / 0.05
Position size = $4,000
This means that to risk only $200, which is 2% of your $10,000 account, you would need to trade $4,000 with a 5% stop loss. Using a proper position sizing strategy like this helps protect your account and ensures you can withstand a series of losses without being wiped out.
Leveraged trading
Leveraged trading allows you to control a larger position while putting up only a small portion of the total value as an initial investment. This means you can gain greater exposure to an asset without needing to deposit its full price.
While leverage can significantly increase potential profits, it also comes with higher risk. Even small price movements can lead to substantial losses, so it should always be used with caution.
Common Bitcoin trading terms
How to start your journey in Bitcoin trading
To stand a chance of succeeding in your Bitcoin trading journey, you need to do the following:
Avoid these common mistakes of Bitcoin traders