Fundamental analysis involves examining the underlying factors that can influence an economy or a market. It’s a broad approach aimed at predicting future price movements and trends by studying a range of elements, including macroeconomic indicators, government and central bank policies, societal factors, and unexpected events such as natural disasters or conflicts.
Fundamental analysis is one of the two main approaches to studying market conditions, the other being technical analysis. However, in practice, few traders rely exclusively on one method. Fundamental traders still pay attention to signals from price action, while technical traders cannot completely ignore macroeconomic data, political developments, or social events that could trigger significant market movements.
Why do traders employ fundamental analysis?
Fundamental analysis can be quite effective in assessing the overall state of an economy, but it is less precise when it comes to predicting exact price levels. For example, a trader examining preliminary estimates of the US GDP or Non-Farm Payrolls data might struggle to get a clear picture of the economy’s health or identify all the factors driving it. They may also need a reliable way to translate this macroeconomic information into a concrete trading strategy, including well-timed entry and exit points.
To tackle this, fundamental traders often create models based on historical data. The goal is to forecast market movements and estimate future prices or exchange rates by analyzing past values of key economic or corporate indicators. These models can vary widely because each trader may interpret the same set of data differently, leading to different conclusions about how it might affect the market. To get a complete view, it’s essential to study every significant fundamental indicator thoroughly.
Similar to stock market analysis, Forex fundamental analysis seeks to determine the “true” value of a currency. Traders do this by examining a wide range of economic, political, and social events. News and economic data from a country or region act much like corporate announcements in the stock market, helping analysts form an understanding of value.
In this guide, we will focus on the key fundamental factors that influence the Forex market in both the short and long term. We’ll explain how to interpret these factors, how they are related, and also provide a brief overview of stock market fundamentals.
What factors do influence the Foreign Exchange market in the long term?
Capital Flows
Capital flows and trade flows together make up a country’s balance of payments, which is closely linked to the demand for that country’s currency over a given period. When the balance of payments is zero, the currency is likely to maintain its current value. A positive balance, on the other hand, indicates that capital inflows are exceeding outflows, which tends to push the currency higher.
Capital flow, as an indicator, measures the net amount of a currency being bought or sold by investors. A positive capital flow means that foreign investments—whether physical or portfolio—into the country exceed the investments leaving it. A negative capital flow suggests the opposite, with domestic investments flowing abroad outweighing foreign investments in the country.
Physical investment flows include foreign direct investments in sectors like real estate, manufacturing, and retail, as well as domestic corporate acquisitions by foreign firms. These transactions require buying the domestic currency and selling foreign currency, which impacts the Forex market. Physical flows reflect real investment activity and respond to changes in economic growth, financial health, and legislation designed to attract foreign investors.
Portfolio investment flows, meanwhile, involve capital moving in and out of a country’s equity and fixed-income markets. A rising stock market tends to draw investors from around the world, increasing demand for the local currency. Conversely, during a market downturn, domestic investors often sell shares and move capital abroad.
Bond markets are also closely tied to Forex movements. Investors typically turn to government bonds during times of economic or political uncertainty because of their safety. Countries offering higher yields attract foreign investment, which in turn increases demand for their currency. Short- and long-term government bond yields are widely used to gauge capital flows, with investors paying close attention to yield spreads between 10-year US government bonds and bonds from other countries. For example, if Australian bonds offer some of the highest yields globally, they will attract foreign investments, boosting demand for the Australian Dollar.
Forex traders monitoring short-term fund flows often look at spreads between 2-year government bonds of different countries. Federal funds futures are another key tool, reflecting market expectations for future US interest rate policy and helping traders anticipate shifts in capital movement.
Trade Flows
Trade flows are closely linked to a country’s net trade balance. Countries can be classified as net exporters or net importers. Net exporters are those whose exports exceed their imports, typically generating a trade surplus. Because international buyers need to purchase the exporter’s currency to pay for goods or services, demand for that currency tends to rise, increasing its value.
Net importers, on the other hand, have imports that surpass exports, usually resulting in a trade deficit. Businesses in these countries must sell their domestic currency to buy foreign currency for imports, which can reduce demand for the local currency and put downward pressure on its value.
For example, imagine the Swiss economy is performing strongly, with a booming stock market, while the US economy offers limited investment opportunities. Investors in the US may sell dollars to buy Swiss francs in order to invest in Swiss assets. This would create a capital outflow from the United States and an inflow into Switzerland. In Forex terms, the US dollar would likely weaken, the Swiss franc would appreciate, and the USD/CHF currency pair would probably decline.
In essence, every international transaction results in two offsetting entries:
The two entries reflect a country’s balance of payments. In theory, they should offset each other and sum to zero, maintaining stability in the economy and currency exchange rates. Each country can have either a positive or negative trade balance and a positive or negative capital flow balance. To prevent excessive fluctuations in its currency, a country seeks to balance these factors.
For example, the United States has recently experienced a significant trade deficit, meaning its imports exceed its exports. To fund this deficit, a negative trade flow can be offset by a positive capital flow, as international investors make direct or portfolio investments. Typically, the country aims to reduce its trade deficit while attracting capital inflows to balance the equation. The net difference between trade and capital flows usually influences the currency’s value: if the overall balance is negative, the US dollar is likely to weaken, whereas a positive balance could boost its value.
Any shift in a country’s balance of payments has a direct impact on its currency exchange rates. Investors monitor related economic reports carefully, interpreting how changes in trade balances and capital flows may affect the currency. For instance, if a country’s trade deficit widens while capital inflows decline, this creates a balance of payments deficit, signaling a likely depreciation of the currency.
The Theory of Purchasing Power Parity
Purchasing Power Parity (PPP) is a theory that suggests currency exchange rates should reflect the relative prices of a standard basket of goods and services between two countries. According to this idea, if a country experiences inflation, its currency should depreciate to restore parity. In other words, rising consumer prices should be balanced by a downward adjustment in the exchange rate.
The basket of goods and services usually represents all items included in a country’s Gross Domestic Product, covering consumer goods, equipment, and government services. Consumer goods and services include items like food and beverages, clothing, rent, utilities, medical services, transportation, education, and recreational activities.
A popular example of PPP in practice is The Economist magazine’s Big Mac Index. This index compares the price of a McDonald’s Big Mac in different countries to estimate whether a currency is overvalued or undervalued. To calculate the PPP exchange rate, you divide the price of a Big Mac in one country by the price in another country. If the resulting rate is lower than the actual exchange rate, the first currency is undervalued; if it is higher, the first currency is overvalued.
For instance, in January 2014, a Big Mac cost $4.58 in the United States and £3.42 in the United Kingdom. The implied PPP exchange rate would be 4.58 ÷ 3.42 = 1.34, meaning $1.34 per £1. At that time, the actual GBP/USD exchange rate was 1.6454. Comparing the two values, we get (1.6454 – 1.34) ÷ 1.34 × 100 = 22.79%, indicating that the British Pound was overvalued by 22.79% against the US Dollar.
More formal PPP data is published by the Organization for Economic Cooperation and Development (OECD) and Eurostat. Their tables show how many units of a country’s currency are needed to buy the same basket of consumer goods and services, helping analysts determine whether a currency is over- or undervalued relative to the US Dollar.
It’s important to note that PPP is most useful for long-term fundamental analysis, as it typically takes 5–10 years for currencies to adjust fully. The theory also assumes goods can be traded freely without taxes, tariffs, or other restrictions, which can limit its accuracy in practice.
The Theory of Interest Rate Parity
Interest rate parity is a theory that suggests differences in interest rates between two currencies will lead to adjustments in the exchange rate, preventing arbitrage opportunities in the market.
For example, if interest rates in Australia are 1.25% while Japan’s rates are 0.25%, the Australian Dollar would need to depreciate by about 1% against the Japanese Yen to prevent arbitrage. This expected future exchange rate is reflected in the forward rate. In this case, the forward rate of the Australian Dollar is at a discount, meaning it buys fewer Yen than it does at the current spot rate. Conversely, the forward rate of the Japanese Yen is at a premium.
However, in practice, the theory has shown limited effectiveness over the past decade. Often, currencies in countries with higher interest rates actually appreciate because central banks raise rates to cool an overheating economy, rather than as a mechanism to prevent arbitrage.
What factors do influence the Foreign Exchange market in the short term?
Short-term movements in the Forex market are often driven by the release of key macroeconomic data from major economies. Both fundamental and technical traders pay close attention to these reports. Important economic data can trigger high volatility and sudden price spikes. Traders who rely on range-bound strategies usually avoid trading around these releases, while breakout traders often take advantage of the large price swings.
Economic reports from the United States typically have the greatest impact on Forex pairs. This is due to the US Dollar’s role as the world’s reserve currency and the United States’ position as the largest global economy. The US is also a major player in international trade, exporting and importing a wide variety of goods and services, which further amplifies the influence of its economic data on currency markets.
Labor market indicators
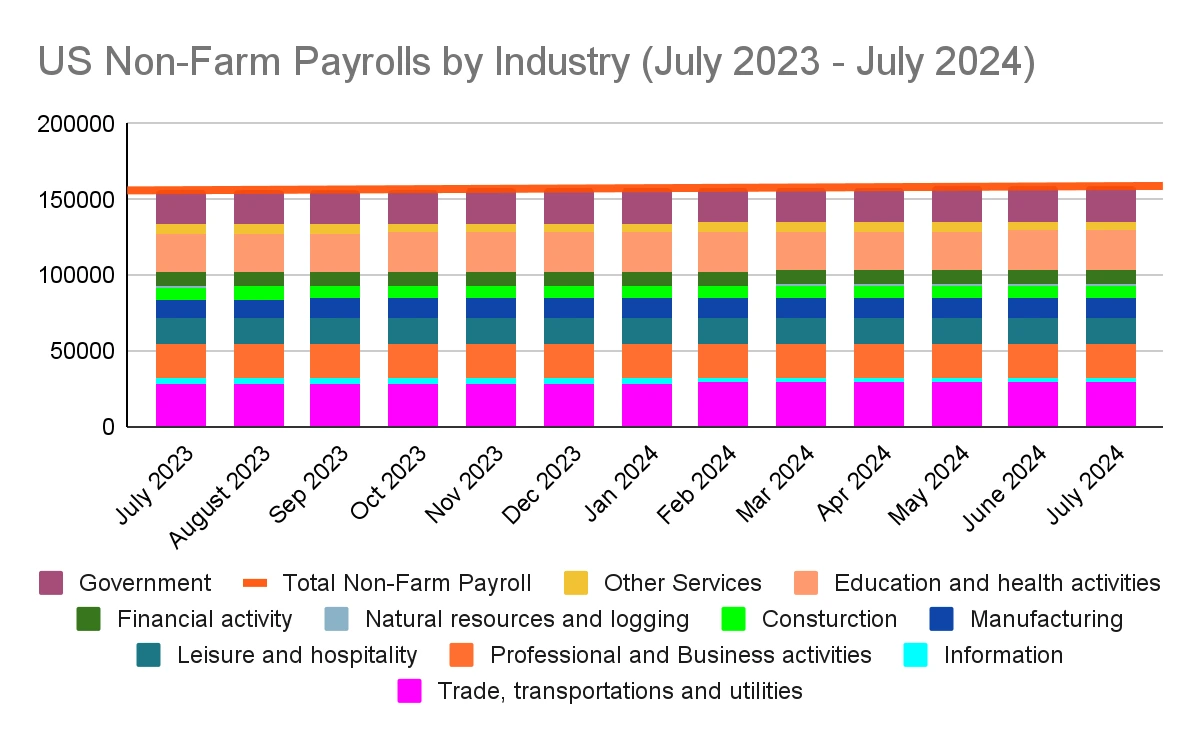
Some US macroeconomic indicators can influence the market so strongly that their effects last for days or even weeks, while others may have little impact on investor sentiment. Among these, the US Non-Farm Payrolls (NFP) report is considered the most important. It often triggers significant volatility not only in currency pairs but across other markets as well, as it reflects the strength of the US labor market and the pace of economic recovery.
A healthy labor market usually signals higher job creation, which boosts consumer spending and retail sales, often prompting tighter monetary policies. Conversely, a weak labor market can dampen consumer confidence and economic activity, increasing the likelihood of more accommodative monetary policies, which can lead to currency depreciation. The NFP report, therefore, serves as a critical gauge for both market participants and policymakers.
Purchasing Managers’ Indexes
Other important US macroeconomic reports include the ISM Manufacturing and Non-Manufacturing surveys, which track business activity. These reports, released by the Institute for Supply Management (ISM), are often more closely watched than similar data from S&P Global, such as the Manufacturing and Services Purchasing Managers’ Indexes (PMIs).
The Non-Manufacturing survey tends to have a stronger influence on daily Forex movements, as the services sector makes up nearly 80% of US GDP, while industry accounts for around 19%. Interestingly, the immediate market reaction to the Non-Manufacturing report is often muted, but its effects accumulate over the following days. Both ISM reports include several underlying components that investors analyze carefully to anticipate potential Federal Reserve policy decisions. They also feature an employment component, offering an early view of the labor market before the Non-Farm Payrolls report, which is why these reports are considered leading indicators.
Over the decades, the significance of various economic indicators has shifted along with changes in the US economy. For example, the US trade balance was a major market mover in the 1990s, but today it no longer ranks among the top ten. Trade balance reports may still attract attention if deficits remain persistently large, but current market focus tends to be on data that better reflects the pace of economic recovery.
Following the 2008–2009 financial crisis, the Federal Reserve linked the tapering of its monthly asset purchases to labor market conditions. Even as quantitative easing was reduced, the Fed maintained historically low interest rates until unemployment reached a sustainable low. This explains why consumer sentiment indicators also significantly impact the US Dollar, as they serve as leading measures of household spending trends.
Central banks’ monetary policy and its impact on the Forex market
The direction of monetary policy set by a country’s central bank is one of the main factors that Forex analysts and traders monitor closely. Central banks act as the monetary authority of their respective countries, with core goals of maintaining price stability and controlling the money supply through various policy tools. Their ultimate aim is to balance economic growth with inflation, ensuring a stable financial system while supporting consistent economic development.
Monetary policy refers to the process of managing the supply of money, its availability, and the cost of borrowing (interest rates) to achieve these objectives. By expanding the money supply, a central bank makes more funds available for spending and investment, which supports economic growth, as household consumption and business investment are key drivers of GDP. However, if the money supply grows too quickly, it can trigger high inflation, eroding the domestic currency’s purchasing power and potentially destabilizing the economy. Conversely, contracting the money supply too much can reduce inflation but may also slow economic growth.
To maintain a balance between healthy growth and a reasonable inflation rate, central banks generally use two main types of monetary policy: expansive and contractionary.
Accommodative (expansive) monetary policy
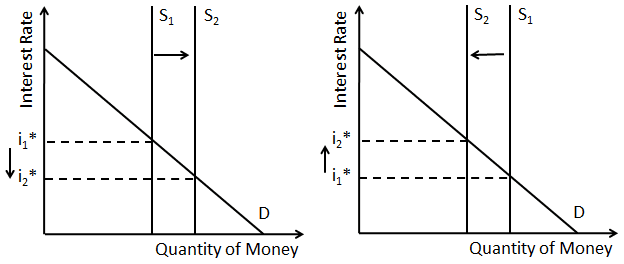
When a central bank adopts an accommodative (expansive) monetary policy, it increases the money supply. This typically lowers borrowing costs, encouraging businesses to invest more and consumers to spend more, which in turn stimulates overall economic growth.
An accommodative monetary policy also has broader effects beyond stimulating growth. Lower real interest rates make a country’s financial and capital assets less attractive to investors, as the potential returns decline. As a result, international investors may reduce their holdings of local bonds, equities, real estate, and other assets, which can weaken the country’s capital account balance. At the same time, domestic investors might look for better returns abroad, further reducing local investment activity. Overall, this lower demand for local assets often translates into decreased demand for the domestic currency, leading to its depreciation.
Additionally, expanding the money supply can increase the risk of higher inflation. More capital circulating in the economy can push prices up, further reducing the currency’s purchasing power. In summary, an accommodative monetary policy generally puts downward pressure on the national currency.
Restrictive (contractionary) monetary policy
When a central bank adopts a restrictive (contractionary) monetary policy, it reduces the money supply, typically by raising interest rates. Higher borrowing costs limit households’ and businesses’ ability to take loans. As a result, businesses invest less and consumers spend less, which reduces overall demand for goods and services. This slowdown in economic activity generally slows economic growth, but at the same time, it helps ease inflationary pressures.
A restrictive policy also has broader effects. Higher real interest rates make a country’s financial and capital assets more attractive to investors, both domestic and international. Foreign investors are likely to increase their holdings of local bonds, equities, real estate, and other assets, improving the country’s capital account balance. Domestic investors may also allocate more capital locally. This increased investment activity boosts demand for the local currency, which often leads to its appreciation. In summary, a restrictive monetary policy generally strengthens the national currency.
What are central banks’ policy decisions usually based on?
Every central bank relies on breakeven figures for key macroeconomic indicators such as inflation, unemployment, and GDP, which are assessed according to its own methodology. These figures are typically compared to “target” or “preferred” levels. When these indicators reach certain breakeven points or start moving consistently in one direction, forming an observable trend, it can signal to the central bank that adjustments to monetary policy may be necessary.
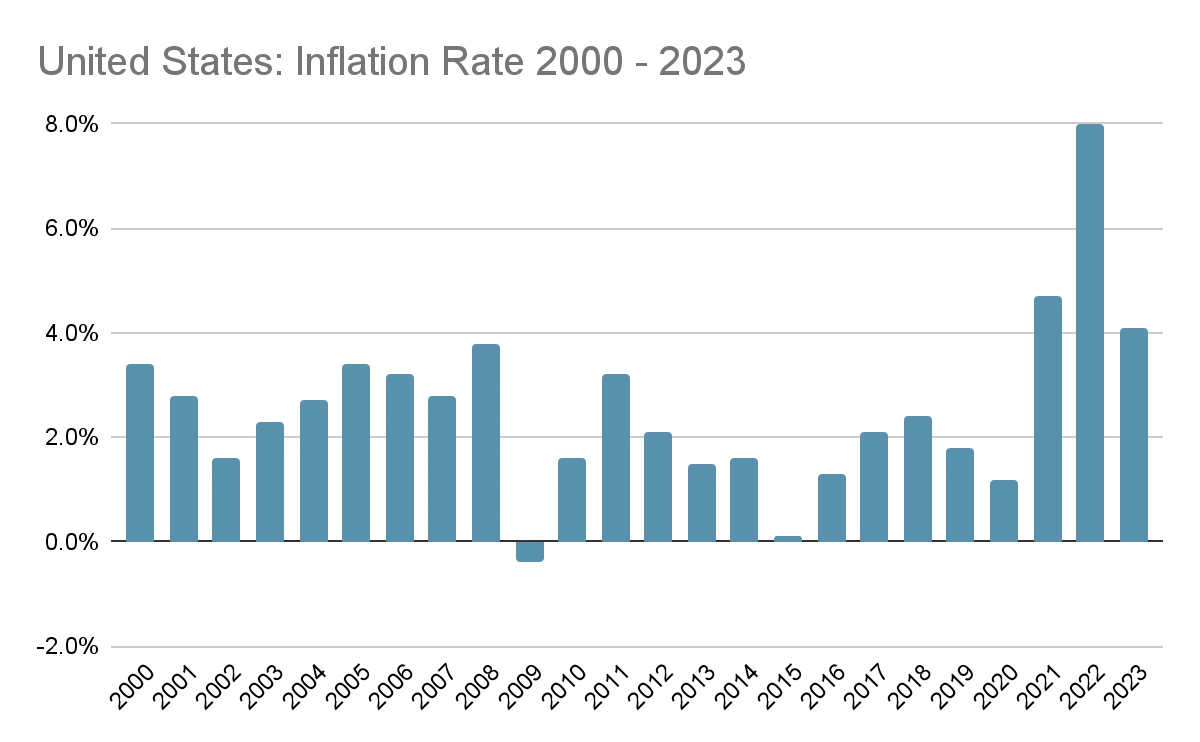
For instance, central banks set acceptable ranges for inflation. Both the Federal Reserve and the European Central Bank target an annual inflation rate of around 2%, a level considered healthy for maintaining price stability while supporting moderate economic growth. If inflation remains well below this target, it suggests subdued inflationary pressure, prompting the central bank to continue with accommodative monetary measures.
In 2022, to tackle rising inflation, the Federal Reserve began raising interest rates. This made the US dollar a more attractive investment, offering higher yields on dollar-denominated assets. Forex traders using fundamental analysis, tracking the Fed’s decisions and interest rate movements, anticipated a stronger US dollar. By September 2022, the US Dollar Index (DXY) reached a 20-year high, while major currency pairs like EUR/USD fell sharply from around 1.13 in early 2022 to below 0.96 by year-end. Traders who relied on fundamental analysis profited by taking long positions on the US dollar and short positions on weaker currencies.
Central banks typically implement policy changes gradually, taking small steps to maintain economic stability and observe the effects on growth and inflation. Benchmark interest rates are usually adjusted in increments of 0.25% to 0.50%, with cycles of rate hikes or cuts lasting one to three years. Rate reductions are often implemented more quickly, ranging from 0.25% to 1.00% per adjustment.
Next, we will explore the relationship between interest rates and inflation.
How are interest rates and inflation related?
The interest rate is the cost a borrower pays to a lender for using borrowed funds, and it is usually set by a central bank. Inflation, on the other hand, measures how quickly the prices of goods and services are rising over time.
For example, imagine that overall prices in a particular market increased by 4% over the past year. If a household spent $4,000 during the first month to cover all expenses, it would now need $4,160 to buy the same amount of goods and services. While some individual items may have risen faster than others—or even become cheaper—the household still needs an extra $160 each month. Without an increase in after-tax income, the household would have to cut savings, choose cheaper alternatives, or borrow money to cover the gap.
It’s important to distinguish between nominal and real interest rates. The nominal interest rate is the rate offered by your bank, showing how much your account balance will grow over time. The real interest rate adjusts the nominal rate for inflation, reflecting the actual increase in your purchasing power. In other words, it shows how much your money truly grows in terms of what it can buy.
The Fisher Effect
According to economist Irving Fisher, real interest rates are independent of monetary factors. This concept, known as the Fisher Effect, can be expressed with a simple equation:
r = i – π
Where:
For example, if your deposit account pays 2.5% annual interest, but inflation rises by 1.5% over the same period, your account balance has increased by 2.5%, yet your actual purchasing power has only grown by 1%.
The Fisher Effect shows that if real interest rates stay constant, any increase in inflation should be matched by an equal increase in nominal interest rates. This demonstrates that, over the long term, purely monetary changes do not affect the relative prices of goods and services in a country.
What are other methods that can control the money supply?
Along with interest rates, central banks can utilize two more tools to control the money supply in an economy – making changes to the reserve requirements of banks and conducting open market operations.
Reserve requirements
Central banks worldwide use reserve requirements to mandate that commercial banks hold a specific portion of client deposits and notes as a reserve. These reserves can either be physically stored as cash in bank vaults or held as deposits with the central bank. The portion of deposits that must be held as a reserve is known as the “reserve ratio.” Banks can also maintain excess reserves, which are amounts held above the minimum requirement.
Reserve requirements directly affect interest rates by controlling the amount of money commercial banks can lend. If a central bank lowers the reserve ratio, it releases more capital for lending, expanding credit availability. Conversely, raising the reserve ratio forces banks to lock in more capital, reducing the funds available for loans.
When banks are required to hold larger reserves, they often raise interest rates on loans, making credit more expensive and slowing economic activity. Higher interest rates, however, benefit depositors, who earn more on their accounts. This can lead to an appreciation of the local currency, as foreign investors are attracted by higher returns and must purchase the currency to invest.
If the reserve ratio is reduced, liquidity increases, lending expands, and interest rates tend to fall. This may reduce foreign investment inflows, leading to lower demand for the domestic currency and a potential depreciation in its value.
Central banks generally avoid frequent changes to reserve requirements, as such shifts can significantly affect lending capacity. Higher reserve requirements can particularly strain smaller banks or those with limited excess reserves.
Open Market Operations
Open market operations are activities in which central banks buy or sell debt instruments, such as Treasury bonds, bills, or notes, to influence the economy by adjusting the money supply. These operations directly impact key factors like currency exchange rates, employment, and overall liquidity, making them closely monitored by fundamental analysts and traders.
In the United States, the Federal Reserve’s Federal Open Market Committee (FOMC) is responsible for implementing monetary policy. The FOMC meets eight times a year to evaluate economic conditions, provide guidance, and decide whether to expand or contract the money supply.
To expand the money supply, the FOMC purchases securities from commercial banks. The money paid to the banks can then be lent to individuals and businesses. As lending activity rises, interest rates typically fall, making capital cheaper and stimulating investment and economic growth. Following the 2008 financial crisis, the Federal Reserve regularly injected liquidity into the economy through monthly bond purchases to encourage recovery.
Conversely, to reduce the money supply, the FOMC sells securities to commercial banks. This reduces the funds available for lending, causing interest rates to rise. Higher borrowing costs tend to slow investment and economic growth.
How are central banks’ policy decisions usually announced?
Every statement made by a central bank’s Chairman, President, or Governor—whether during a regular or special testimony—can trigger significant movements in the Forex market. Traders closely analyze these statements for clues on whether the current monetary policy stance will continue or if adjustments may be introduced.
Central banks maintain well-organized communication with investors. They provide a publicly disclosed schedule of policy meetings, speeches, and other announcements. Large corporations and financial institutions often employ expert analysts to interpret these statements into actionable insights. Retail traders are advised to follow the actions of these major market participants, as they often have a clearer understanding of central bank intentions.
Central banks rarely provide straightforward statements because economic reactions and macroeconomic trends are uncertain. For example, a bank may announce an interest rate hike, but if subsequent data shows a weakening economy, officials may indicate a pause in policy changes. Policymakers generally prepare markets for gradual adjustments by subtly altering the tone of their communications.
New traders should be aware of the high volatility that often accompanies policy announcements. If the central bank’s decision or statement surprises investors, it can lead to sharp currency movements. Inexperienced traders should exercise caution, manage risk carefully, and reconsider opening new positions during these periods.
Central banks may also use verbal interventions—remarks intended to influence market perception of a currency. These interventions can suppress speculation or deliberately adjust the local currency’s exchange rate. For example, the Governor of the Reserve Bank of Australia once stated that the bank aimed for a weaker Australian Dollar to support economic rebalancing following a fading mining investment boom. Such comments are likely to reduce demand for the currency.
Consumer Price Index as an indicator
In the United States, the Consumer Price Index (CPI) is published monthly by the Bureau of Labor Statistics. It tracks price changes for a basket of roughly 80,000 consumer goods and services, primarily reflecting purchases by urban households, which account for about 87% of the US population. The general CPI includes sales taxes but excludes income taxes and investment prices such as equities and bonds.
A more closely watched measure is the core CPI, which excludes volatile categories like food and energy prices. The Federal Reserve primarily uses the core CPI to assess inflation trends and guide monetary policy adjustments.
Another important metric is the Chain-Weighted CPI, which provides a more accurate reflection of actual consumer behavior by accounting for substitution effects and new product biases. For example, if consumers switch from a higher-priced item to a lower-priced alternative, the Chain-Weighted CPI captures this change, unlike the standard core CPI.
The CPI has a predictive nature and often generates significant volatility in both Forex and stock markets—not only on the day of its release but also in the subsequent one to two weeks. Traders and investors closely monitor the report for insights into potential central bank actions at upcoming policy meetings.
In an expanding economy, a faster-than-expected rise in the annualized core CPI over a period of several months tends to support the national currency, as consumer prices move closer to the central bank’s inflation target. Such a trend also signals that economic recovery may be accelerating.
However, if CPI inflation rises well above the central bank’s target, it could harm the economy by creating excessive inflationary pressure.
In a sluggish or weak economic environment, a slower-than-expected increase in the annualized core CPI may indicate weak inflationary pressure. This could prompt the central bank to continue or expand accommodative monetary policies to stimulate growth. In such cases, the national currency is likely to depreciate.
Gross Domestic Product as an indicator
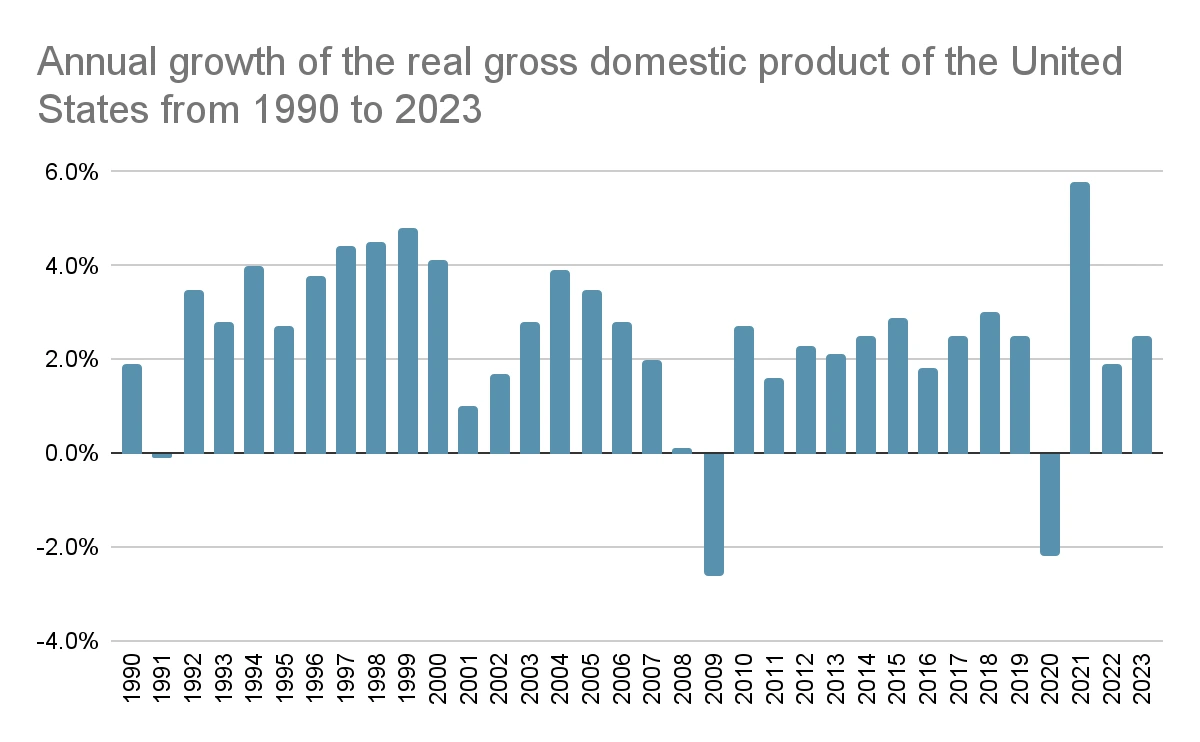
The Gross Domestic Product (GDP) is a key fundamental indicator that reflects the overall size and health of an economy. It measures the total monetary value of all goods produced and services delivered by a nation over a specific period, such as a quarter or a year. Strong GDP growth is generally associated with rising wages and low unemployment, as companies expand their workforce to meet increased demand. Significant changes in GDP growth, either upward or downward, usually have a substantial impact on the local currency.
Forex traders often monitor GDP growth rates to anticipate potential interest rate changes. A strong GDP growth rate suggests higher consumer spending and overall economic expansion. As consumer spending rises, it may lead to inflationary pressure, which central banks are likely to address through interest rate hikes, particularly if consumer prices increase faster than GDP growth.
In the United States, the GDP report is published by the Bureau of Economic Analysis in three stages: preliminary, revised (second estimate), and final. Experienced Forex traders analyze the relationship between these figures rather than focusing solely on individual reports. For instance, if the preliminary GDP growth estimate is 4.5% but the final figure comes in at 3.0%, positive market sentiment and its effect on the currency may be muted. Conversely, if the final GDP exceeds the preliminary estimate, it is likely to have a substantial positive effect on the local currency.
There are three types of market reactions to the release of GDP numbers:
First, a GDP reading that falls short of market expectations—based on the consensus of analyst estimates—typically triggers a sell-off in the local currency. For example, a lower-than-expected UK GDP growth would signal a slowdown in economic activity and reduce the appeal of the British Pound, as it lowers the likelihood of an interest rate hike by the Bank of England. If you are monitoring the GBP/USD pair, the Pound will likely lose value as investors sell it and buy the US Dollar. The larger the deviation from market expectations, the more pronounced the Pound’s depreciation tends to be.
Second, a GDP reading that comes in line with market expectations generally requires additional analysis. Traders will often compare the current figures not only to consensus estimates but also with preceding quarters or the same period from the previous year. Because investors may interpret these comparisons differently, market reactions may be mixed, with price action reflecting a sorting out of the details.
Third, a GDP reading that exceeds market expectations usually supports the local currency. Faster-than-expected UK GDP growth, for instance, would likely encourage buying of the Pound and selling of the US Dollar, causing the GBP/USD pair to gain value. The greater the difference between the actual GDP reading and market expectations, the stronger the currency’s appreciation is likely to be.
Labor market fundamental indicators
A healthy labor market is a major driving force behind economic growth. In the United States, employment fundamentals are closely monitored by Forex traders and fundamental analysts, as they provide critical insights into the overall economic health and potential monetary policy adjustments. Key indicators include the Non-Farm Payrolls report, the unemployment rate, and labor force participation, among others. These data points help traders anticipate consumer spending trends, inflationary pressures, and possible moves by the Federal Reserve, all of which can significantly impact currency valuations.
Understanding the labor market allows investors to assess the strength of the economy. Strong job creation typically indicates rising consumer confidence and increased spending, which can spur GDP growth and may lead the central bank to consider tightening monetary policy. Conversely, weak employment data may signal slower economic activity, prompting accommodative measures that could affect the US Dollar and global Forex markets.
When the economy is faring well, the figure released will most frequently fall within the 50,000-300,000 range. A positive reading, especially if it far exceeds market consensus, tends to considerably bolster the US Dollar and vice versa.
Purchasing Managers’ Index (PMI)
The Purchasing Managers’ Index (PMI) is a timely fundamental indicator that reflects business sentiment across various sectors, including manufacturing, construction, and services. In the United States, the PMI is released on the first business day of every month by the Institute for Supply Management (ISM), a non-profit organization with over 40,000 members. Similar indicators for the Euro Area and the United Kingdom are published by S&P Global.
The PMI is a composite index derived from surveys of more than 400 purchasing managers across the country. Each sub-index within the PMI has a specific weighting, capturing factors such as new orders, production levels, employment, supplier deliveries, and inventory levels. Together, these sub-indices provide a snapshot of overall economic activity and help investors anticipate trends in growth, inflation, and currency demand.
Results from the surveys are usually diffused into 3 options – “better”, “same”, or “worse”. The value of the PMI can be calculated in the following manner:
PMI = (P1 * 1) + (P2 * 0.5) + (P3 * 0), where
The PMI value ranges from 0 to 100, where 100 indicates that all survey respondents reported improving conditions, 0 indicates that all reported deteriorating conditions, and 50 signals no change in conditions.
From a fundamental analysis perspective, 50.0 is a critical threshold. A PMI above 50.0 suggests that the sector—whether manufacturing, construction, or services—is expanding, which typically points to overall economic growth. Therefore, the PMI serves as a leading indicator of potential GDP growth.
A PMI reading around 42.0 is also closely monitored. If the PMI stays above 42.0 over time, it signals sustained economic expansion, with values between 42.0 and 50.0 indicating the strength of that growth. Conversely, a PMI below 42.0 over a prolonged period suggests the economy may be in recession.
Traders pay attention to month-to-month changes in the PMI because these often trigger short-term volatility in Forex markets. PMI readings that exceed market expectations generally strengthen the national currency, while readings below expectations can weaken it. Even less severe contractions than anticipated can support the local currency.
Retail sales and consumer spending
The US Census Bureau releases the retail sales report around the 13th of each month. This report presents the dollar value of merchandise sold in the retail trade sector, based on a sample of companies of various sizes. Retail sales serve as a timely indicator, reflecting both retail trade performance and overall price level activity. In the United States, consumer expenditures account for nearly two-thirds of total GDP.
Retail sales are considered both a coincident indicator, showing the current state of the economy, and a pre-inflationary indicator, signaling potential central bank actions. A significant rise in retail sales above market expectations, especially mid-cycle, may indicate rising inflation. This can prompt the central bank to raise interest rates, supporting the national currency while potentially causing a sell-off in stocks and bonds. Conversely, a notable drop in retail sales may signal weak inflation and could prompt a rate cut, likely devaluing the currency.
Another key indicator is the Personal Consumption Expenditures (PCE) Price Index, published monthly by the US Bureau of Economic Analysis. The PCE measures consumer spending on goods and services, capturing average price changes for durable and non-durable goods and services purchased by individuals, families, and non-profit organizations. Unlike the CPI, which is based on household surveys, the PCE uses data derived from the GDP report.
The PCE index uses 2012 as a base year with a base value of 100, comparing current consumption prices to those in 2012. If the PCE rises faster than expected, it signals that the Federal Reserve’s inflation target may be approaching, likely supporting the US Dollar. If the PCE rises more slowly than expected, it indicates suppressed inflation, which may weaken the currency. The Bureau also publishes the core PCE index, which excludes volatile components like food, oil, and gas, and serves as the inflation measure guiding Federal Reserve adjustments to the federal funds rate.
Housing market indicators
Housing market reports published by the US Census Bureau and the National Association of Realtors, as well as by the Lloyds Banking Group in the UK, provide valuable insights into activity within the housing and mortgage sectors. These reports help investors and analysts gauge the health of the real estate market and its impact on the broader economy.
In the United States, key housing indicators include New Home Sales, Existing Home Sales, and Pending Home Sales. These reports reflect the volume of home purchases and the pipeline of future sales, providing insight into consumer confidence, borrowing activity, and potential economic growth. Other indicators, such as Housing Starts and Building Permits in the US and Canada, along with the Halifax House Price Index in the UK, are considered of lesser significance but still offer useful context on construction activity and property price trends.
Economic sentiment indicators
Economic sentiment is typically assessed using fundamental indicators that gauge the optimism or pessimism of households and businesses regarding a country’s or region’s economic outlook. Traders who focus on fundamentals often monitor these indicators to estimate potential changes in consumer spending. There are three key monthly indicators used to measure economic sentiment:
Other events affecting the Forex market
Forex is a global, interconnected market, meaning that events occurring anywhere in the world can have an immediate impact on currency exchange rates.
Stock market fundamental analysis
In the stock market, fundamental analysis seeks to determine a stock’s intrinsic value by examining both economic and financial factors. Analysts consider everything that might influence a stock’s worth—from broad macroeconomic conditions and industry trends to microeconomic elements like management efficiency and company performance.
The process typically begins with an assessment of the overall economy, followed by an analysis of the relevant industry, and finally a detailed review of the individual company. Analysts often create models using publicly available data to estimate what a company’s stock price should be, referred to as its intrinsic value.
If a stock’s intrinsic value is estimated to be above its current market price, analysts may recommend it as a “Buy” or “Overweight.” Conversely, if the intrinsic value is below the current market price, the stock may be considered overvalued and assigned a “Sell” or “Underweight” rating. Investors often act based on these recommendations, buying stocks expected to rise and selling or shorting those expected to fall.
A real-world example is Apple during the early stages of the COVID-19 pandemic. While many expected the tech sector to slow, Apple’s April 2020 earnings report surpassed expectations. Investors using fundamental analysis—tracking demand, production, and subscription revenue—recognized Apple’s resilience. On the day of the report, Apple’s shares surged 7% and continued to climb, boosting the Nasdaq 100 index throughout 2020.
Fundamental factors influencing the stock market generally fall into two main categories:
Stock market fundamental analysis will usually consider both categories of factors.
Quantitative Fundamentals
Publicly traded companies are required to disclose their financial performance through financial statements. These statements provide quantitative data that fundamental analysts and traders use to make informed investment decisions. The three primary financial statements they focus on are the balance sheet, the income statement, and the cash flow statement.
The balance sheet shows a company’s assets, liabilities, and shareholders’ equity at a specific point in time. It is based on the fundamental accounting equation:
Corporate Assets = Corporate Liabilities + Shareholders’ Equity
Assets encompass everything the company owns or controls, including cash, inventory, machinery, and real estate. Liabilities represent debts the company must repay, while equity reflects the owners’ contributions and retained earnings from prior years.
The income statement, in contrast, provides a summary of the company’s performance over a period, such as a quarter or a year. It details revenue, expenses, and the resulting net income from business operations during that period.
The cash flow statement records all cash inflows and outflows over a specific period. It typically includes cash generated from operating activities, cash used for investing activities, and cash flows from financing activities, giving insight into how the company manages its liquidity and funds its operations.
A company’s cash position is generally much harder to manipulate than its reported profits. While skilled accountants may find ways to adjust earnings on the income statement, altering actual cash in the bank is far more difficult. For this reason, many fundamental analysts and investors consider the cash flow statement a more reliable indicator of a company’s true financial performance.
Qualitative Fundamentals
First, consider the company’s business model – whether it generates revenue from selling products, like fast food, or relies mainly on royalties and franchise fees. Understanding the primary source of income helps evaluate the sustainability of earnings.
Second, examine the nature of the industry – including market share, client base, growth potential, business cycles, and regulatory environment. These factors indicate how the company performs relative to competitors and how resilient it is to market changes.
Third, assess the company’s competitive advantage. Long-term success depends on the ability to maintain a unique edge over competitors. Examples include Coca-Cola’s strong brand recognition or Microsoft’s dominance in PC operating systems. A solid competitive advantage creates a “moat” that can protect profits and shareholder value for decades.
Fourth, evaluate the management team. Even the strongest business models can fail without competent leadership. While retail investors may not meet executives directly, they can review corporate websites, executives’ resumes, past achievements, and recent stock transactions to gauge effectiveness and alignment with shareholder interests.
Fifth, consider corporate governance – the policies governing relationships and responsibilities between stakeholders, managers, and directors. Investors prefer companies that operate transparently, ethically, and efficiently, respecting shareholder rights. Poor governance may signal attempts to hide information about the company’s financial health or other critical areas of the business.