Price Action Trading
- Written By thinkforexbrokers
- Updated:
Price action is the study of how a trading instrument—such as a currency pair, stock, commodity, or cryptocurrency—behaves on the chart, with the goal of predicting its future movements. By identifying recurring patterns or signals in the market, traders attempt to forecast price direction and take advantage of short-term opportunities.
Some traders rely on what’s called naked or pure price action. This method involves analyzing raw price charts without the use of indicators or other tools, allowing them to sharpen their chart-reading skills and avoid the clutter of too much information.
When analyzing candlesticks or bars on a chart, traders focus on recognizable price action signals—patterns that suggest where the market may move next. Skilled traders often spot these signals quickly, drawing on their ability to identify candlestick formations and historical price behaviors that tend to repeat over time.
Why is price action so popular in Forex trading? The difference between price action and technical analysis
Price action trading enjoys a particularly high popularity among forex traders, which can be attributed to the following reasons:

First, the forex market delivers unmatched liquidity compared to other market segments, allowing traders to enter and exit their positions quickly and with ease

Second, the market is so mature that it is easier to detect recurring patterns and trends

Third, the market is always active, but rarely reaches significant peaks or troughs. This makes it suitable for beginners who are willing to experiment with smaller positions before increasing their trade size as they gain more experience.
When comparing price action with traditional technical analysis, the key distinction lies in simplicity versus complexity. Price action signals are subtle “flickers” of market activity that skilled traders can recognize almost instantly and act upon in real time.
Technical analysis, on the other hand, often involves complex calculations across multiple timeframes, using a variety of indicators to forecast potential outcomes. Price action strips this process down by focusing solely on the movement of a single instrument within the chosen timeframe. Most price action traders deliberately avoid layering additional indicators, relying instead on raw market data to guide their decisions.
In this guide, we shall discuss the different trend reversal and trend continuation patterns, based on one, two or more segments of the price chart (candlesticks), which traders can use when analyzing the global markets.
First, we shall begin with the single candlestick formations.
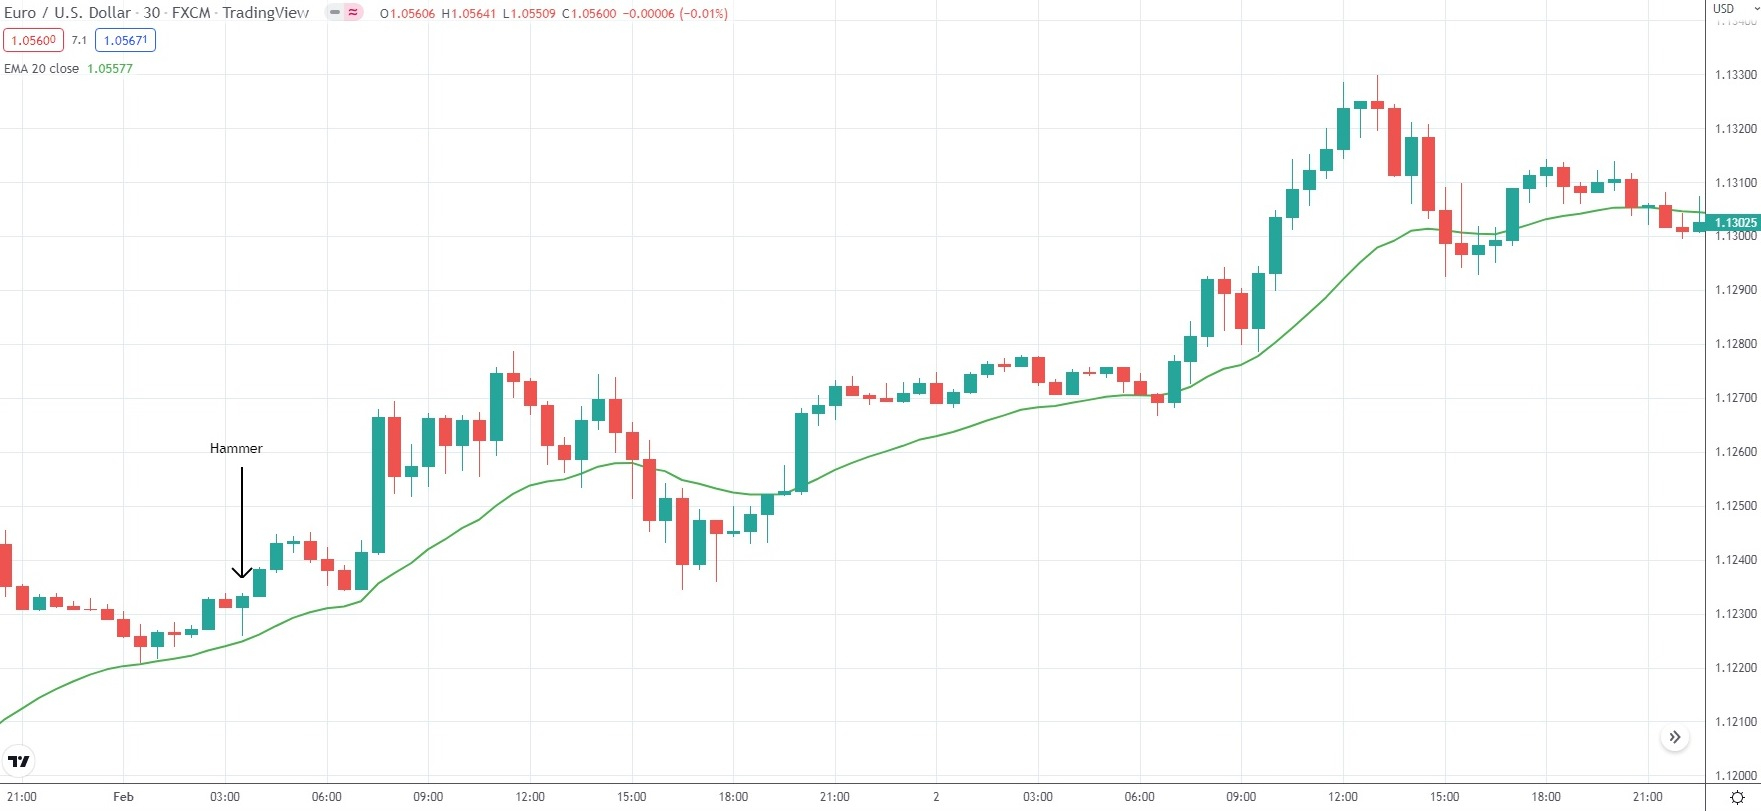
“Hammer” and “Hanging Man” Candlestick Patterns
Although these candlestick formations may look alike at first glance, they serve distinct purposes. Both patterns share common visual traits—long lower wicks, small bodies, and little to no upper wicks.
The “Hammer” is a bullish reversal signal that typically emerges after a sustained bearish trend. It is often found at support levels, suggesting that price action has reached a trough and could soon shift upward. For traders, this pattern may present an opportunity to enter long positions. However, confirmation is crucial—this could come in the form of a bullish candle that closes above its open price, or even above the high of the candle preceding the Hammer.
The Hammer is characterized by the following key features:
- Short or no upper wick
- Long lower wick, preferably two or three times longer than the body of the candle
- The body is at the upper end of the candle
- Green hammers are preferable over red ones as they represent stronger bullish sentiments.
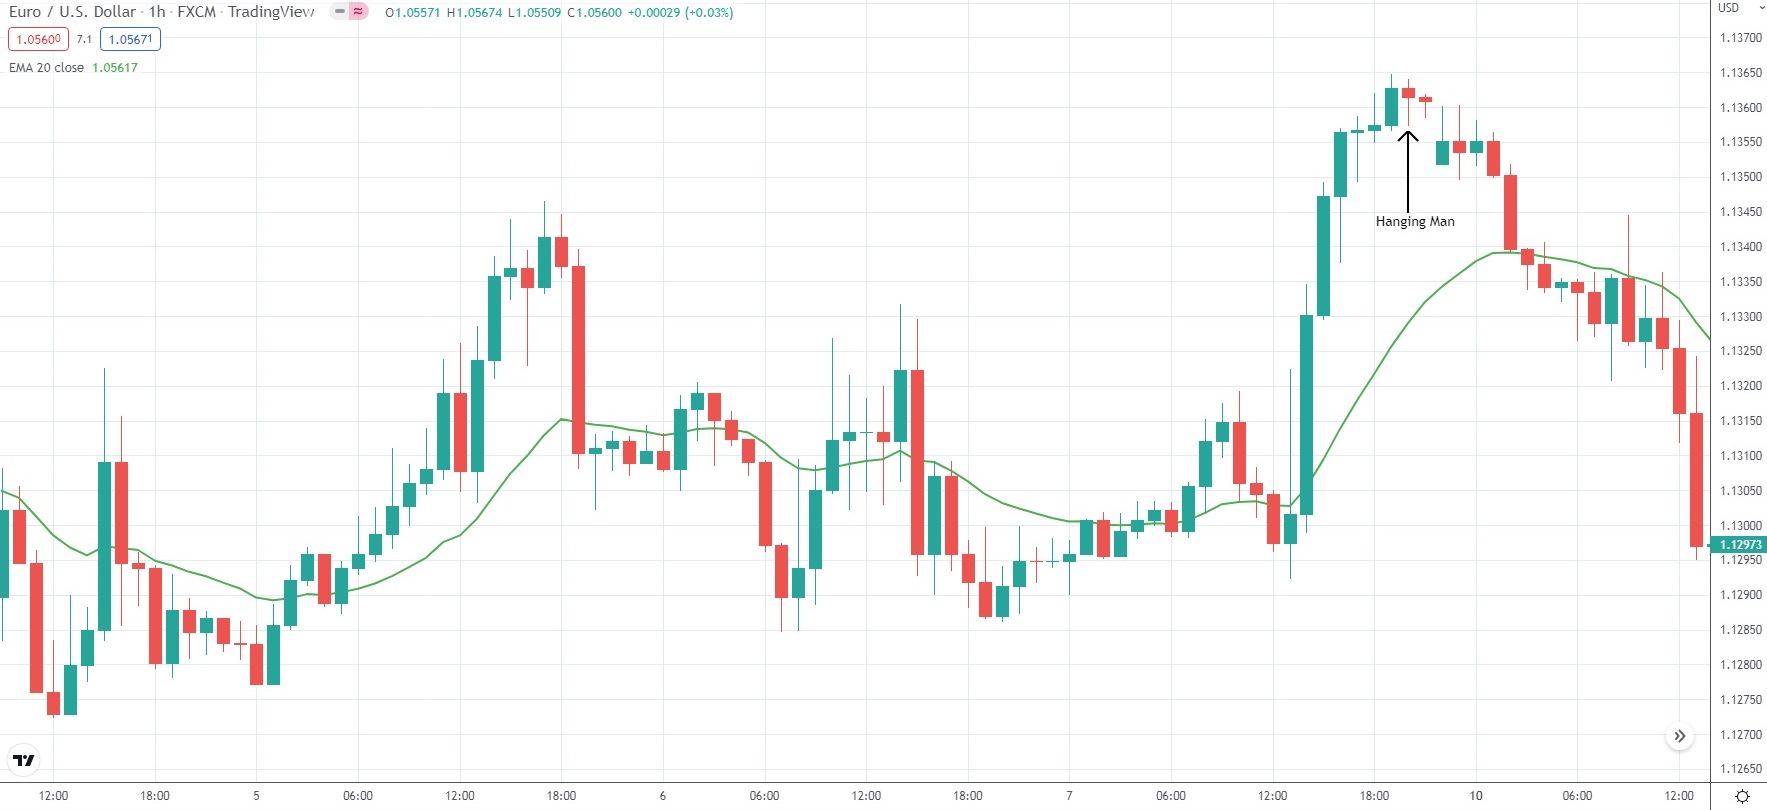
The “Hanging Man” is a bearish reversal candlestick pattern that generally forms after a strong bullish trend. It is most often seen near resistance levels, signaling that upward momentum may have reached its peak and the market could be preparing to reverse downward. For traders, this setup can highlight an opportunity to go short.
However, just like with the Hammer, caution is advised—false signals are common. Traders typically wait for confirmation before acting, which may come in the form of a bearish candle that closes below its open price or drops beneath the low of the candle that appeared before the Hanging Man.
The Hanging Man is identified by the following key features:
- Short or no upper wick
- Long lower wick, preferably two or three times longer than the body of the candle
- The body is at the upper end of the candle
- A red Hanging man is preferable as it has a greater potential to move upside compared to its green counterpart.
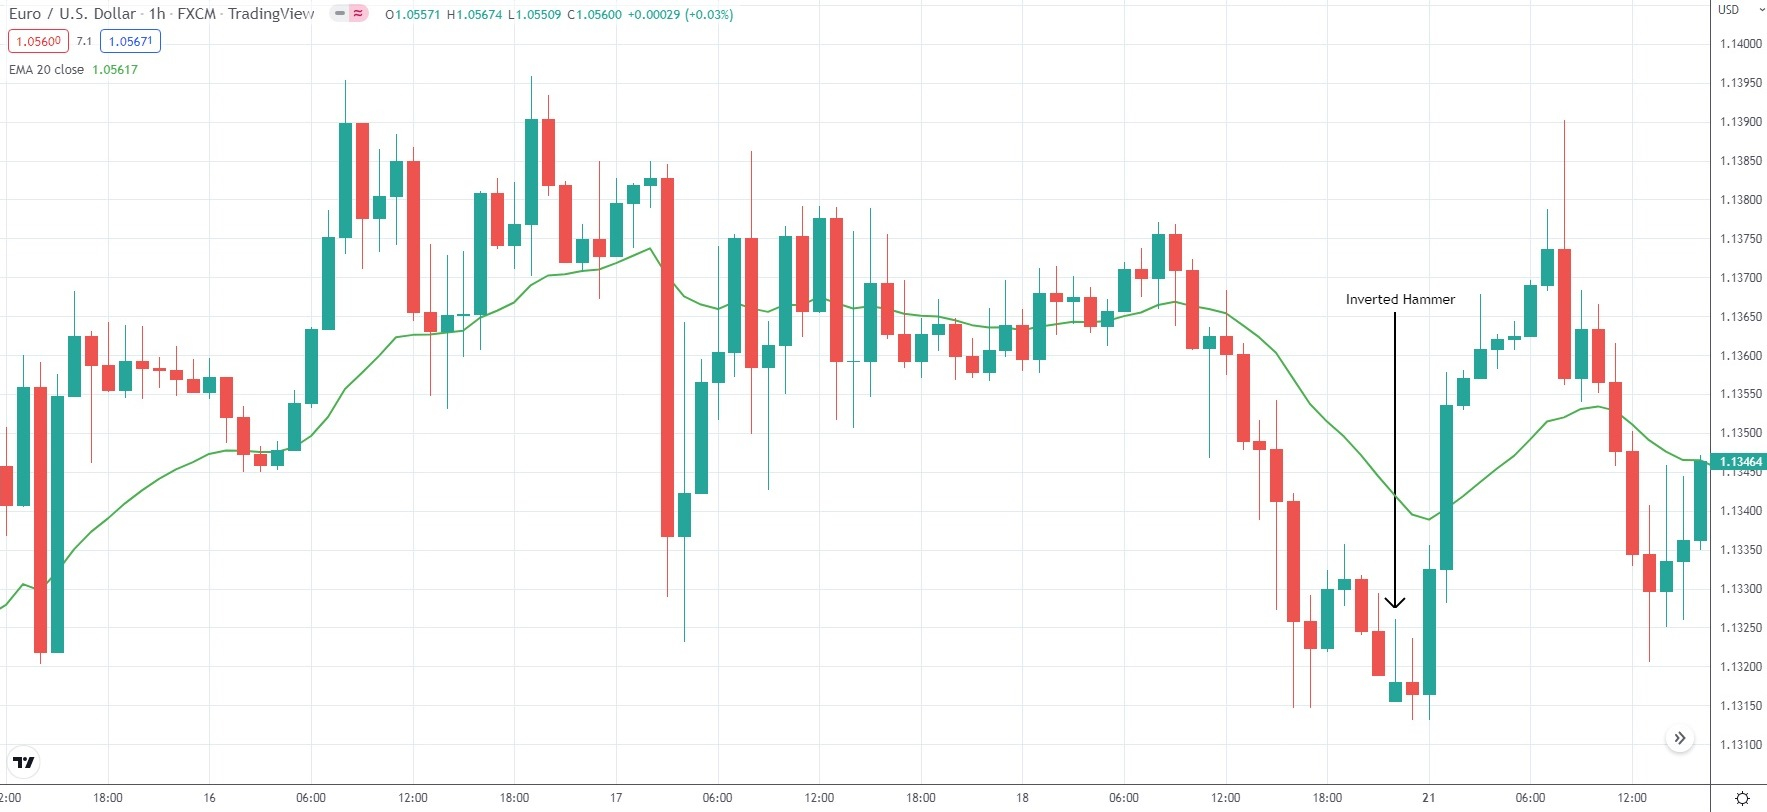
“Inverted Hammer” and “Shooting Star” Candlestick Patterns
Much like the two patterns we covered earlier, the inverted hammer and the shooting star may look almost identical on a chart. Both feature long upper wicks, relatively small bodies, and very short—or even nonexistent—lower wicks. The key difference lies in the context in which they appear.
The inverted hammer typically emerges after a sustained downtrend, signaling a potential bullish reversal. It often shows up near support levels, suggesting that selling pressure has weakened and the market could be preparing to push higher. For traders, this setup represents a possible opportunity to go long. Still, confirmation is essential before entering a trade—such as a green candle closing above its open, or even better, above the high of the inverted hammer itself.
Occasionally, the inverted hammer may form close to a regular hammer, strengthening the case that the support zone is holding firm.
The inverted hammer pattern is defined by the following key features:
- Short or no lower wick
- Long upper wick, preferably two or three times longer than the body of the candle
- The body is at the lower end of the candle
- Green Inverted Hammers are preferable as they suggest strong bullish sentiments.
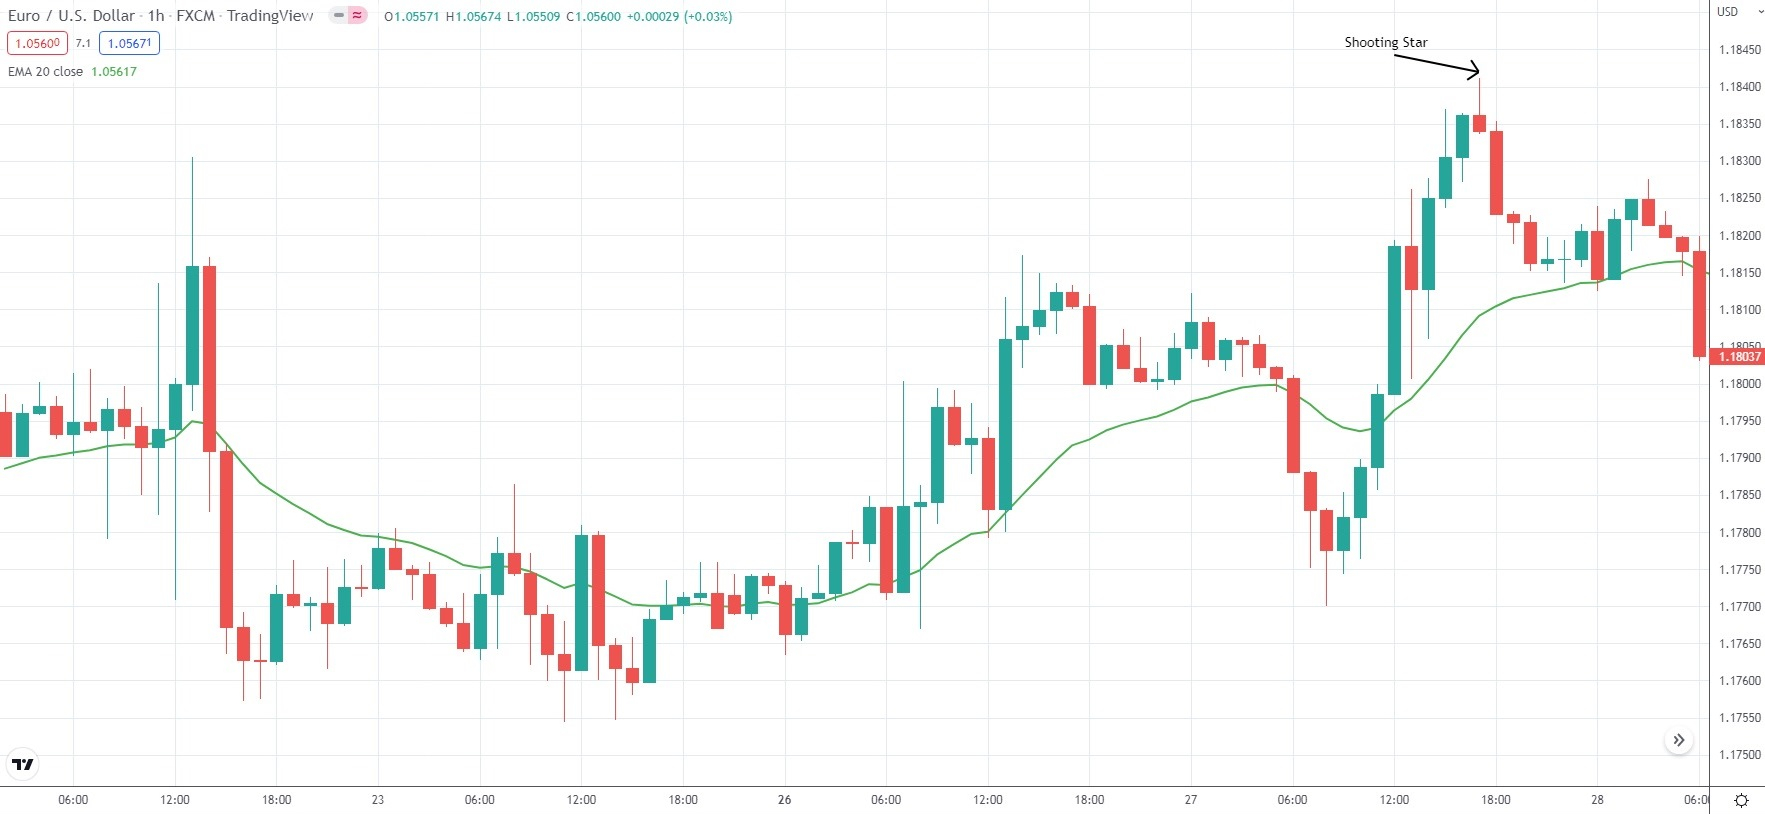
The “Shooting Star” pattern generally forms after the market has been in an upward trend, signaling a potential shift toward bearish sentiment. It is often seen at resistance levels and indicates that prices may start declining after reaching a peak. While it suggests an opportunity to go short, traders are advised to wait for confirmation that selling pressure is indeed taking control. This confirmation usually comes in the form of a red candle that closes below the open price or beneath the low of the candle preceding the “Shooting Star”.
The key features of this pattern are a small body positioned near the lower end of the price range, a long upper wick that is at least twice the size of the body, and little to no lower wick. It typically appears after an uptrend and close to resistance levels, signaling weakening bullish momentum and the potential for a downward reversal.
- Short or no lower wick
- Long upper wick (preferably three times longer than the body of the candle)
- The body is at the lower end of the candle
- Red Shooting Stars are preferable because they are more bearish than green candles.
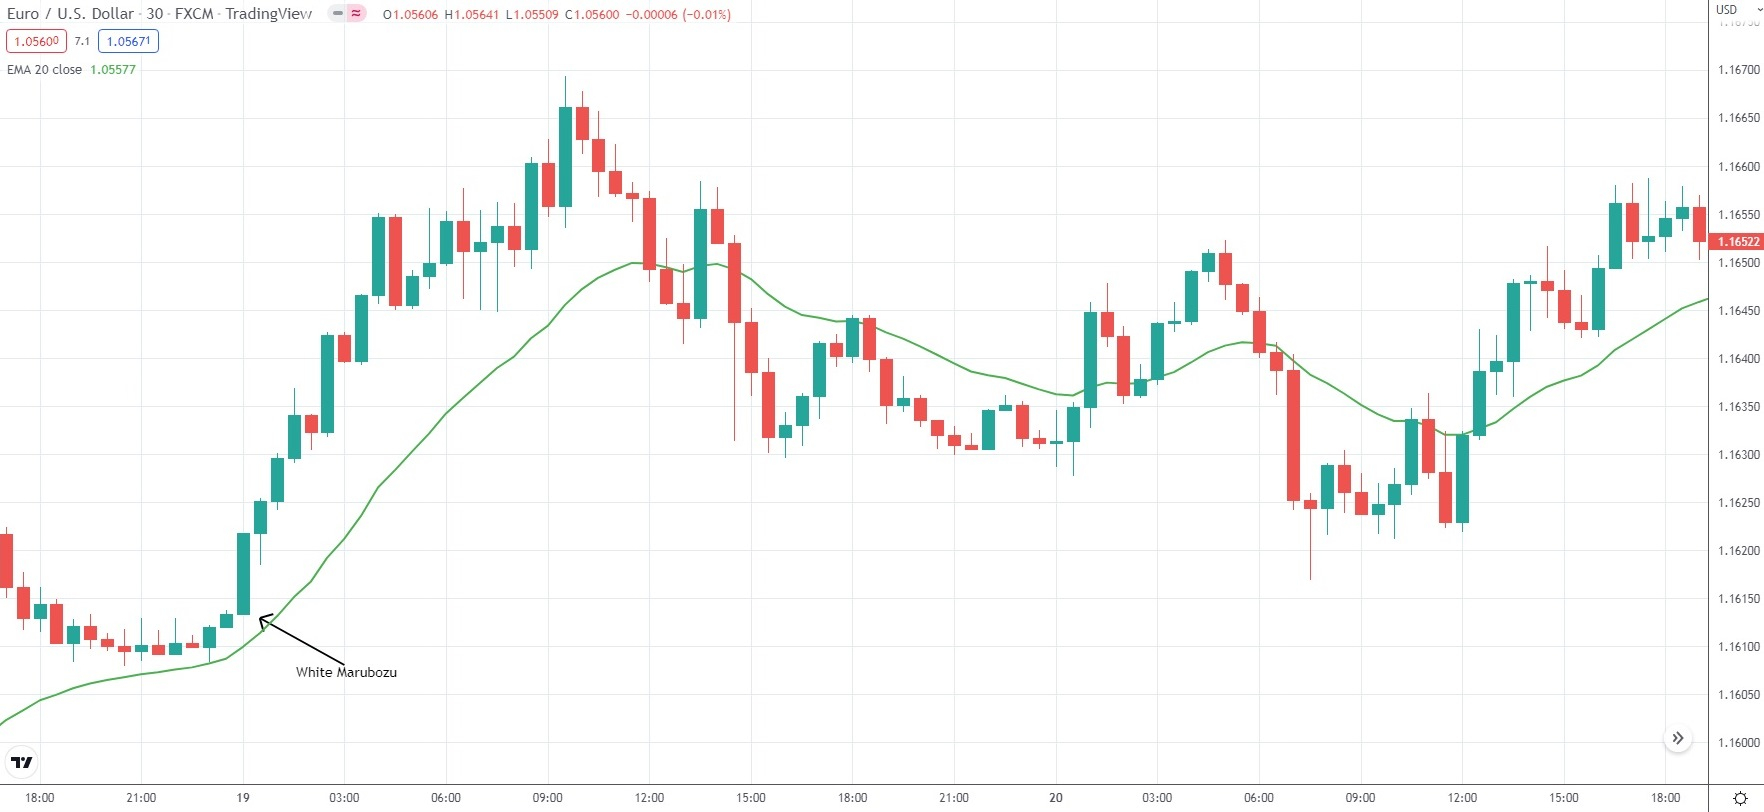
White Marubozu
The White Marubozu is a single-candle pattern that usually forms after a bearish trend, often signaling the potential for a bullish reversal. It is characterized by a large bullish body with no upper or lower wicks, indicating strong buying pressure and a possible shift in market direction to the upside. When this pattern appears at the end of a downtrend, it is considered a stronger indication of reversal compared to when it forms within an ongoing uptrend, where it may simply signal continuation of the bullish momentum.
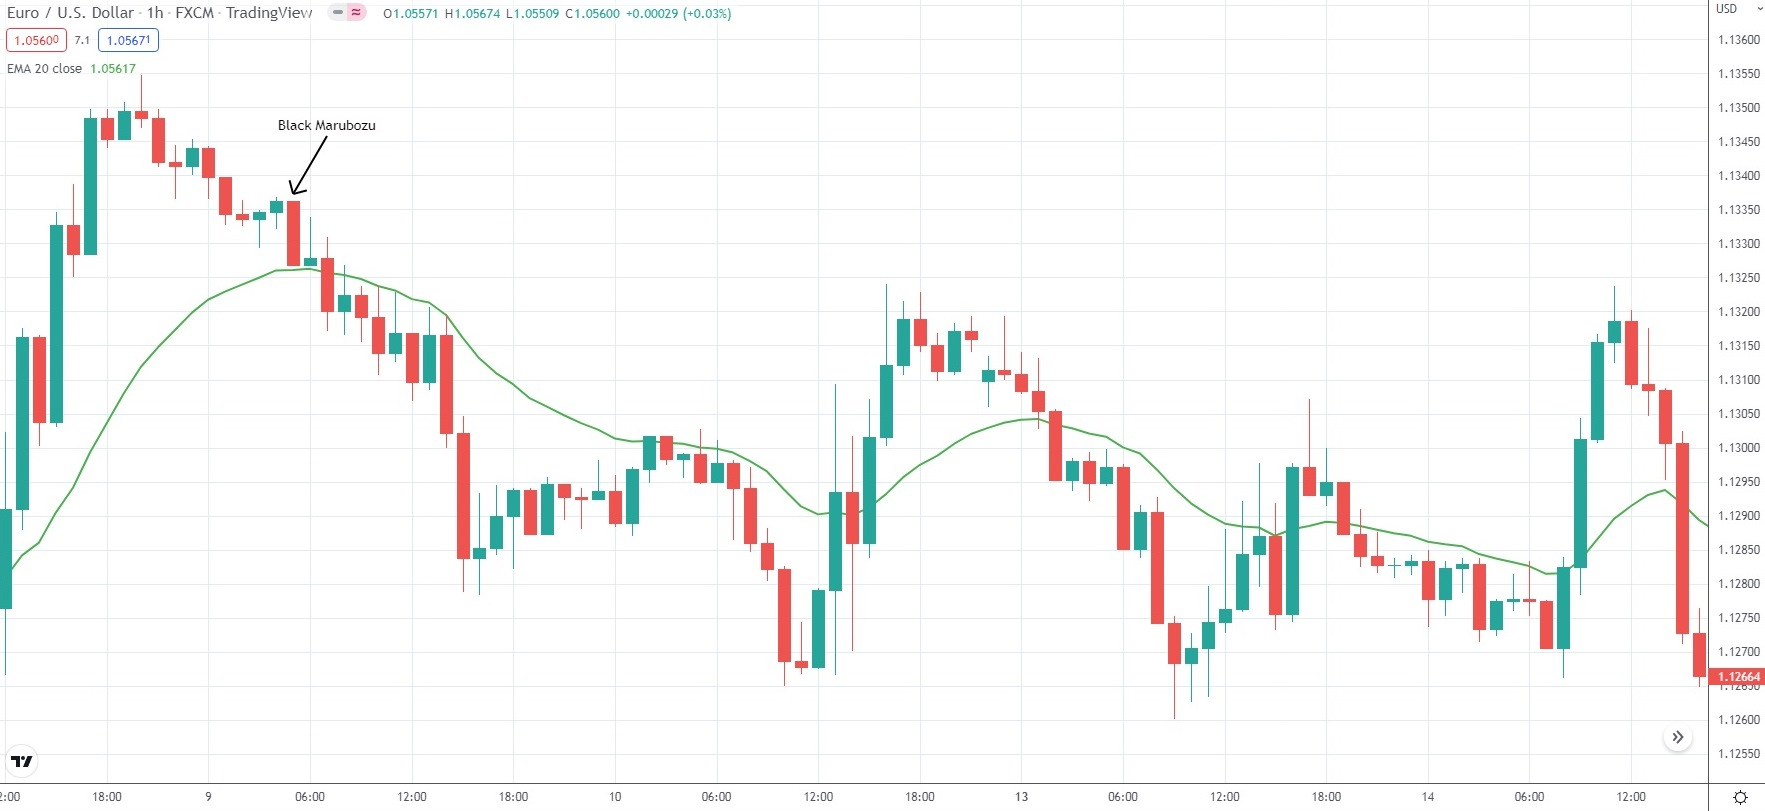
Black Marubozu
The Black Marubozu is a single-candle pattern that forms after a bullish trend and often signals a bearish reversal. It is defined by a large bearish body with no upper or lower wicks, reflecting strong selling pressure and the likelihood of prices moving lower. When this pattern emerges at the peak of an uptrend, it is considered a stronger indication of reversal than when it appears within an existing downtrend, where it may simply confirm ongoing bearish momentum.
Doji Candles
Doji candles appear on the chart when the opening and closing prices of an asset are almost the same, resulting in a very small body compared to regular candles. These formations are valuable because they highlight moments of indecision in the market, often signaling that a trend may be losing strength and a reversal could occur. Traders use doji candles to either position themselves early in a new trend or exit before an existing trend comes to an end. However, doji setups are generally more reliable when they occur within trending markets.
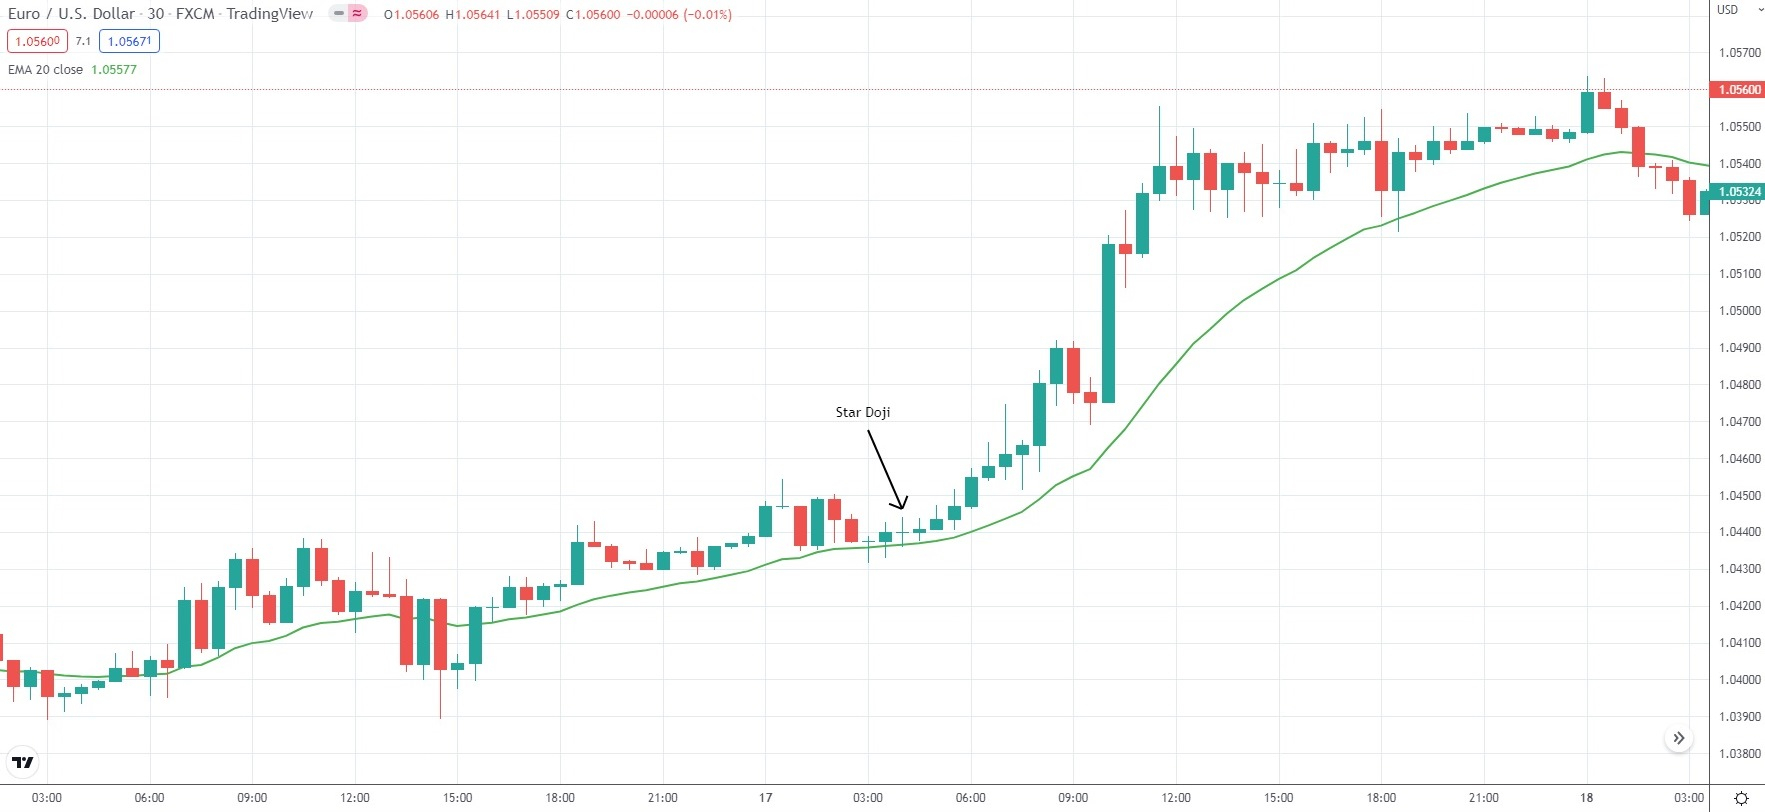
There are four main types of doji candles: star doji, long-legged doji, dragonfly doji, and gravestone doji. The star doji is identified by its short upper and lower wicks of nearly equal length, with the opening and closing prices being virtually identical. This formation typically reflects market indecision, as neither buyers nor sellers have gained control during the observed period.
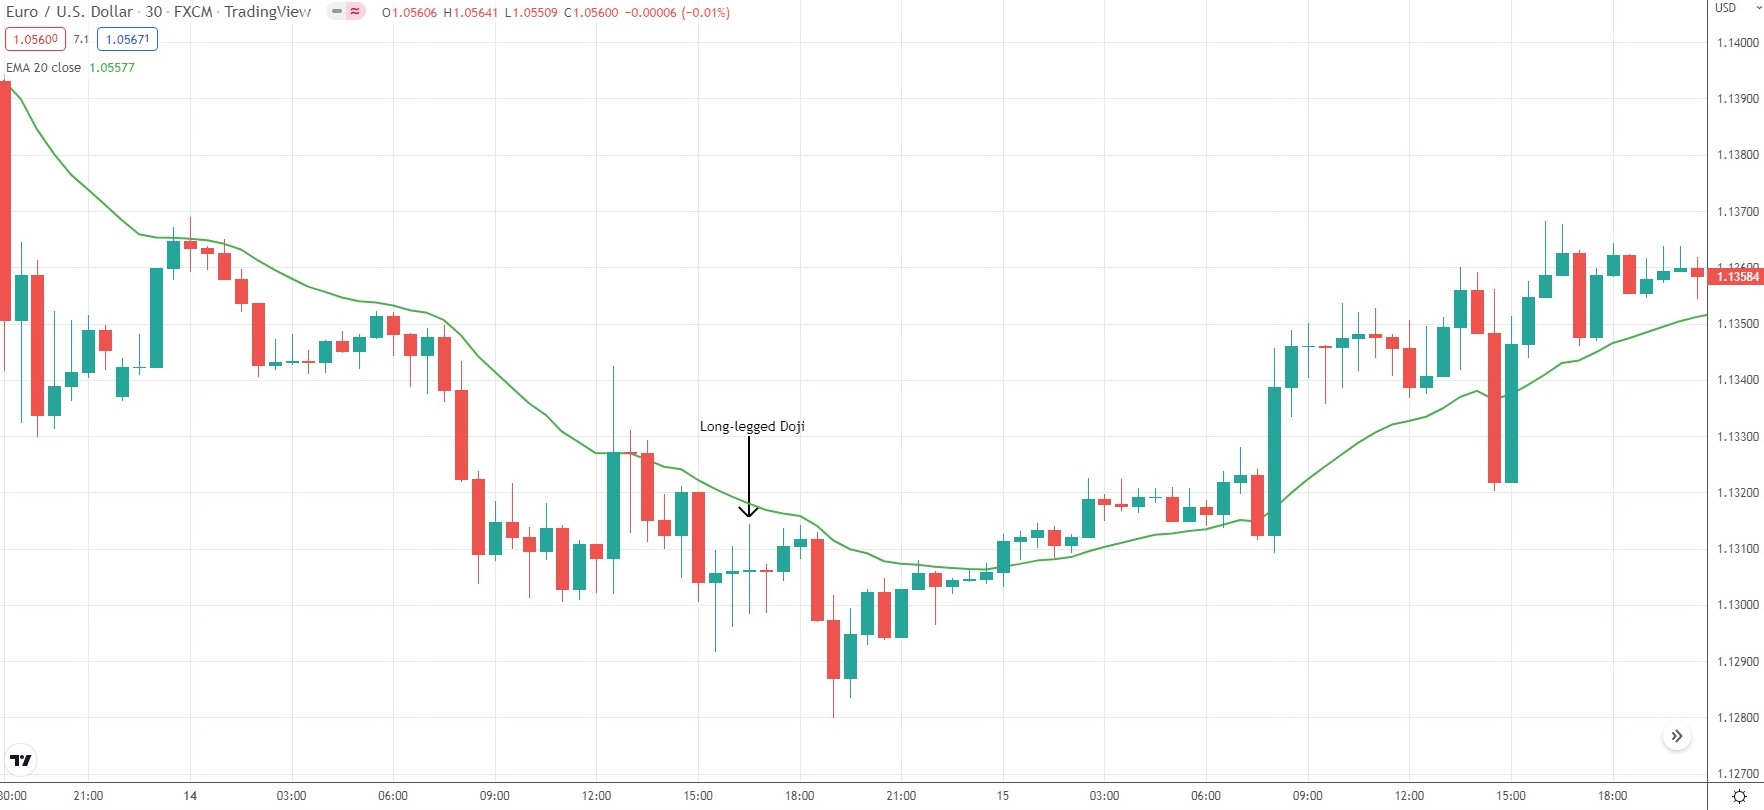
The long-legged doji is characterized by its extended upper and lower wicks, showing that the price fluctuated within a much wider range during the trading period. This pattern reflects an intense struggle between buyers and sellers, with both sides actively pushing the price in opposite directions. Despite the heightened activity, the candle closes with little to no difference between the opening and closing prices, signaling indecision and a potential shift in market direction.
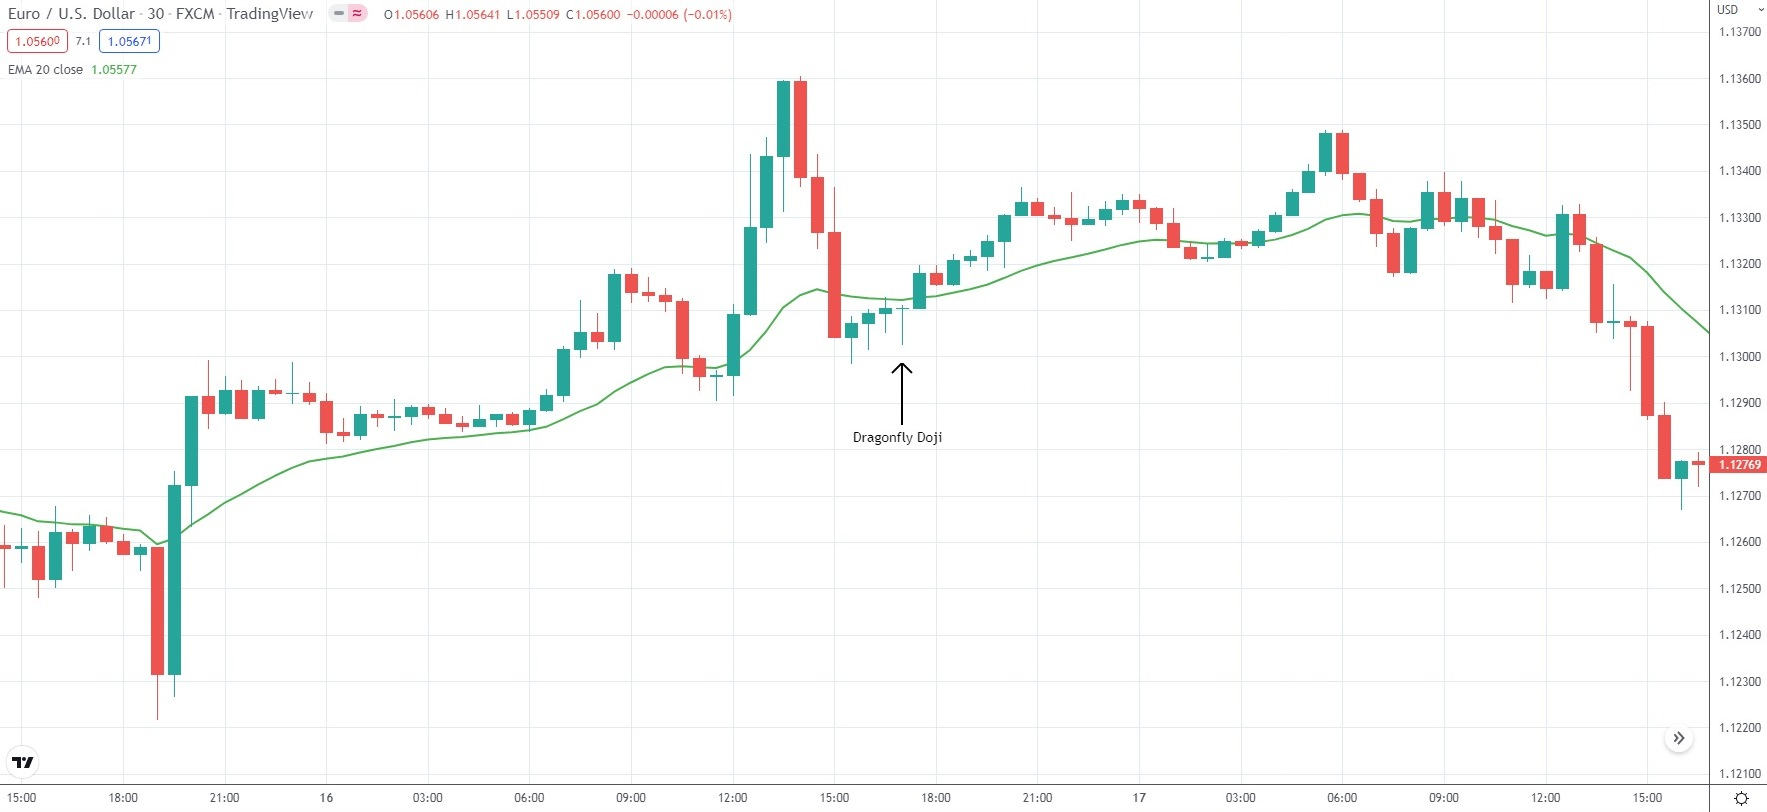
The dragonfly doji is formed when the open and close occur at the same price level, positioned near the high of the trading range, while a long lower wick extends downward. This pattern indicates that sellers initially pushed the price lower, but buyers regained control and drove it back up to the opening level by the close. The absence of an upper wick suggests that the bullish pressure was strong enough to resist further downward momentum. As a result, the dragonfly doji is generally seen as a bullish signal, often pointing to a potential reversal to the upside.
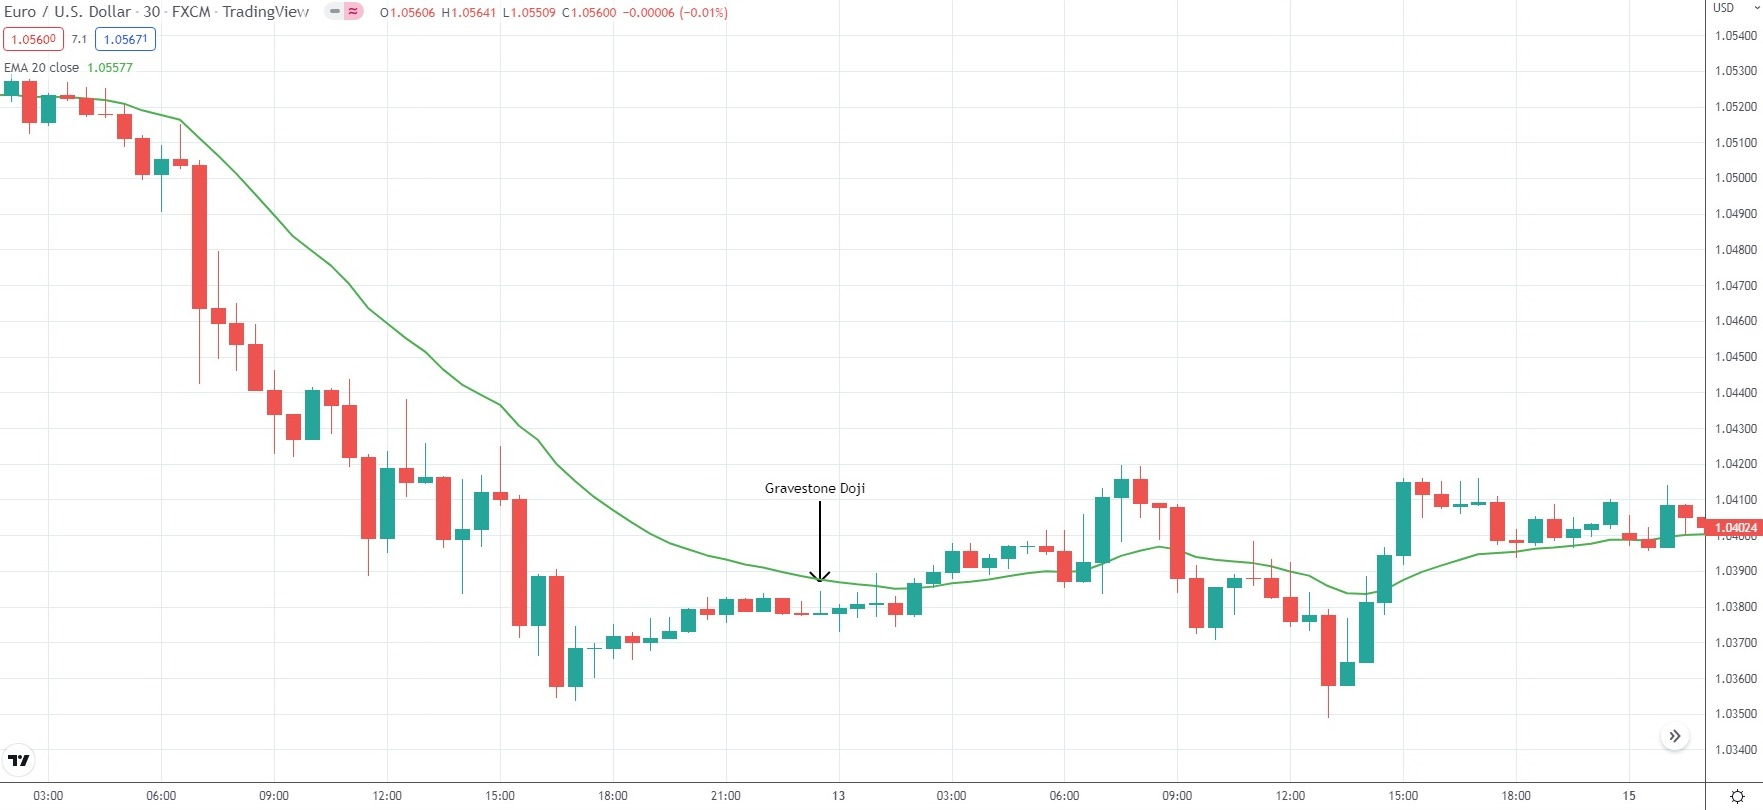
The gravestone doji forms when the open and close occur at the same price level near the low of the trading range, with a long upper wick extending above. This pattern shows that buyers managed to push the price upward during the session, but sellers regained control and drove it back down to the opening level by the close. The lack of a lower wick indicates that bearish pressure dominated by the end, leaving little to no support from buyers at lower levels. As a result, the gravestone doji is generally interpreted as a bearish signal, often pointing to a potential reversal to the downside.
Short-term price patterns can also be formed with two candlesticks. Some of the most well-known double-candlestick formations are the Bullish and Bearish Engulfing patterns, the Dark Cloud Cover and Piercing Line, as well as Tweezer Tops, Tweezer Bottoms, and the Harami pattern.
Bullish and Bearish Engulfing patterns
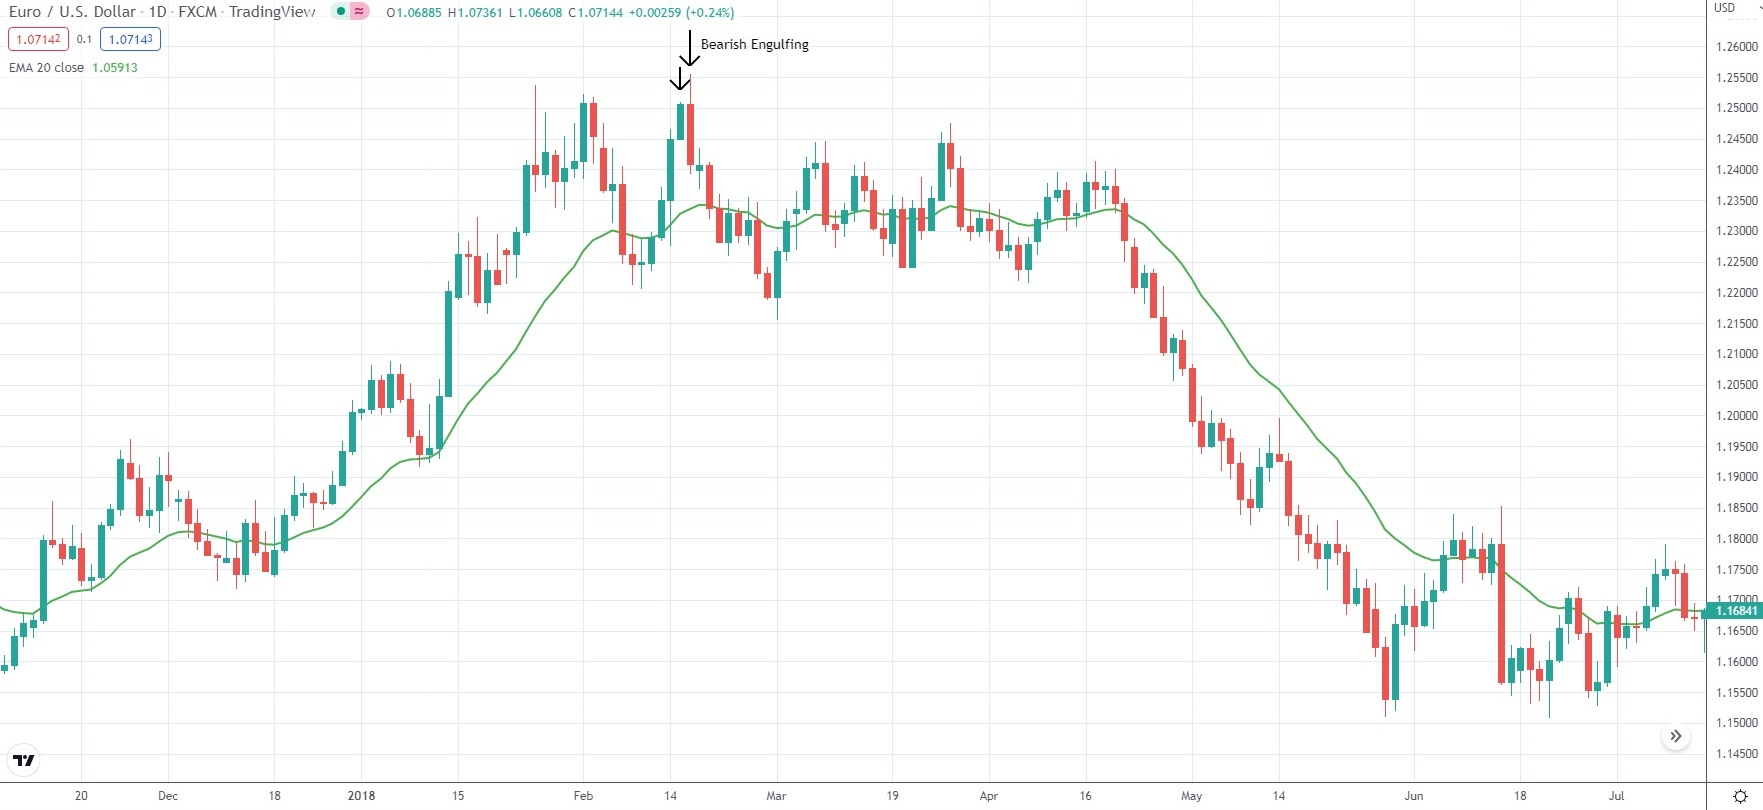
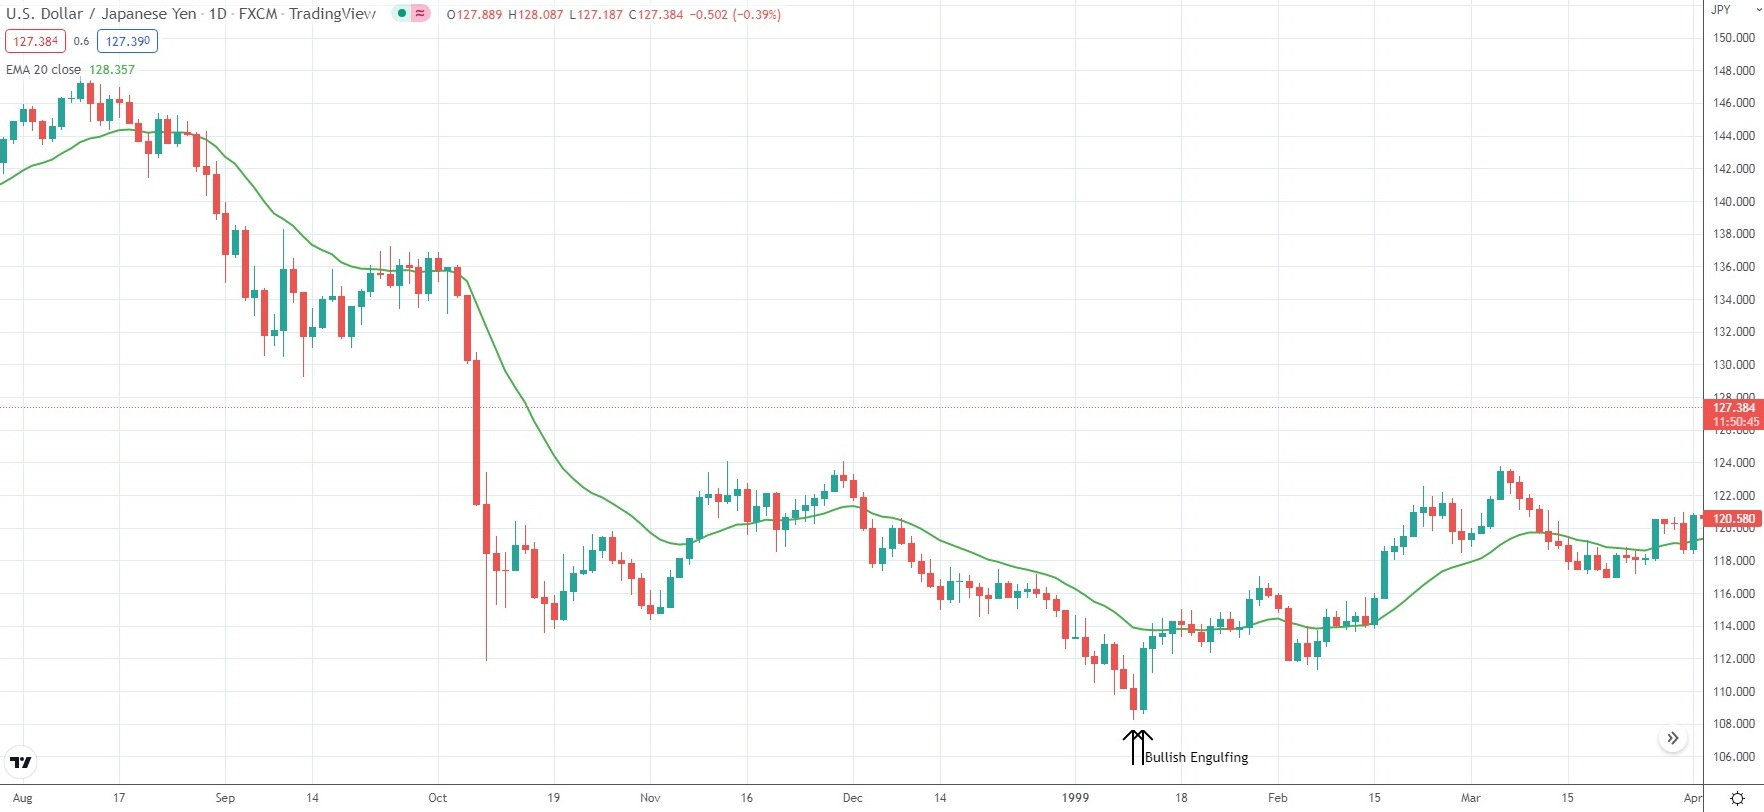
The Engulfing pattern is a two-candle formation that often signals a trend reversal. It tends to be a strong indicator when the right market conditions are present. Because this formation is primarily associated with reversals, it requires a clear and established trend in the market to be effective.
In a confirmed trend, a Bearish Engulfing pattern suggests that the market has likely reached a top and may be preparing for a downward move. On the other hand, a Bullish Engulfing pattern signals that the market may have found a bottom, indicating the potential beginning of an upward trend.
To correctly identify an Engulfing formation, certain conditions must be met.
First of all, the market should exhibit a confirmed short-term or long-term trend.
Second, one of the candles should be bullish and the other bearish. When the first candlestick is bearish, the second should be bullish to complete a Bullish Engulfing formation.
Third, the body of the first candle should be smaller than that of the second candle. The second candlestick does not need to additionally engulf the wick of the first candle. Yet, its high-low range should be equal to or wider than the high-low range of the first candle.
In a textbook Engulfing formation, the second candle’s body completely covers the first candle, ideally including its wicks. When this setup follows a Doji candle, it gains even greater significance, as the Doji reflects prior indecision that is then forcefully resolved by the Engulfing move.
The relative size of the candles is also critical. A small first candle followed by a large, dominant second candle makes for a much stronger signal. Conversely, when the size difference between the two candles is minor, the formation weakens, and if both candles are nearly the same size, the pattern loses its relevance—often resulting in nothing more than sideways market movement.
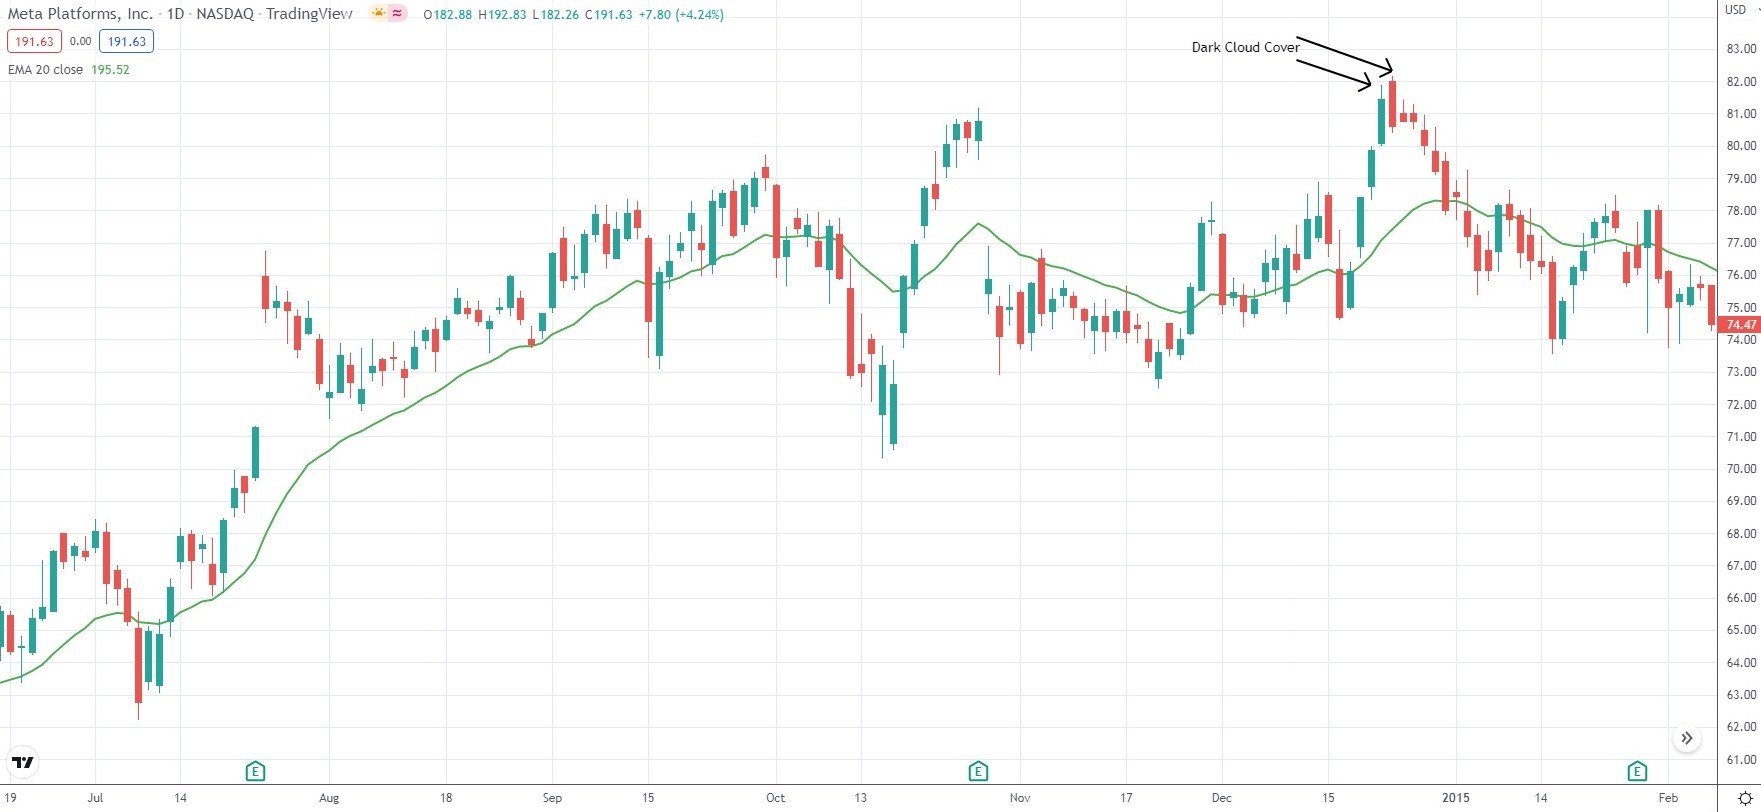
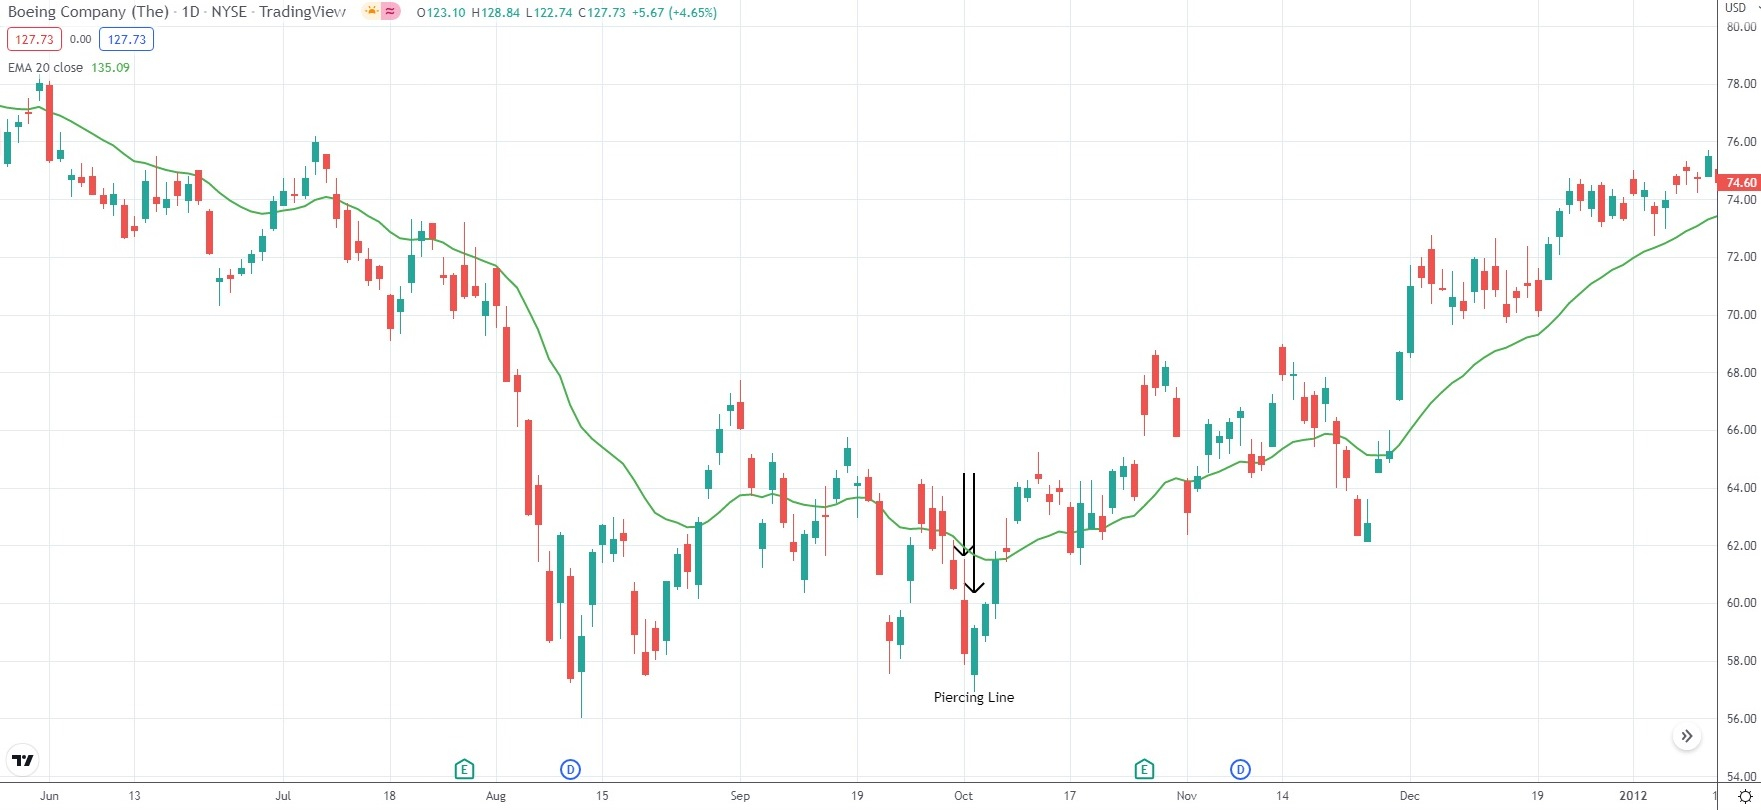
Dark Cloud Cover, Piercing Line
he Dark Cloud Cover and its counterpart, the Piercing Line, are classic two-candle reversal patterns that signal a potential trend change.
The Dark Cloud Cover develops at the top of an uptrend and warns of a possible bearish reversal. The first candle is strong and bullish, while the second is bearish and smaller in size. Ideally, the second candle opens above the high of the first candle, creating an upward gap, and then drops to close inside the body of the first candle, preferably below its midpoint. The deeper the penetration into the first candle’s body, the stronger the bearish signal.
For the perfect setup, the bearish candle should close beneath the midpoint of the preceding bullish candle. However, in highly liquid markets such as forex, strict conditions may soften. Instead of opening above the prior high, the second candle might open just above the previous close, and the bearish close may not extend as deeply. Still, if the close does not reach at least halfway into the first candle’s body, the formation is considered weak or inconclusive.
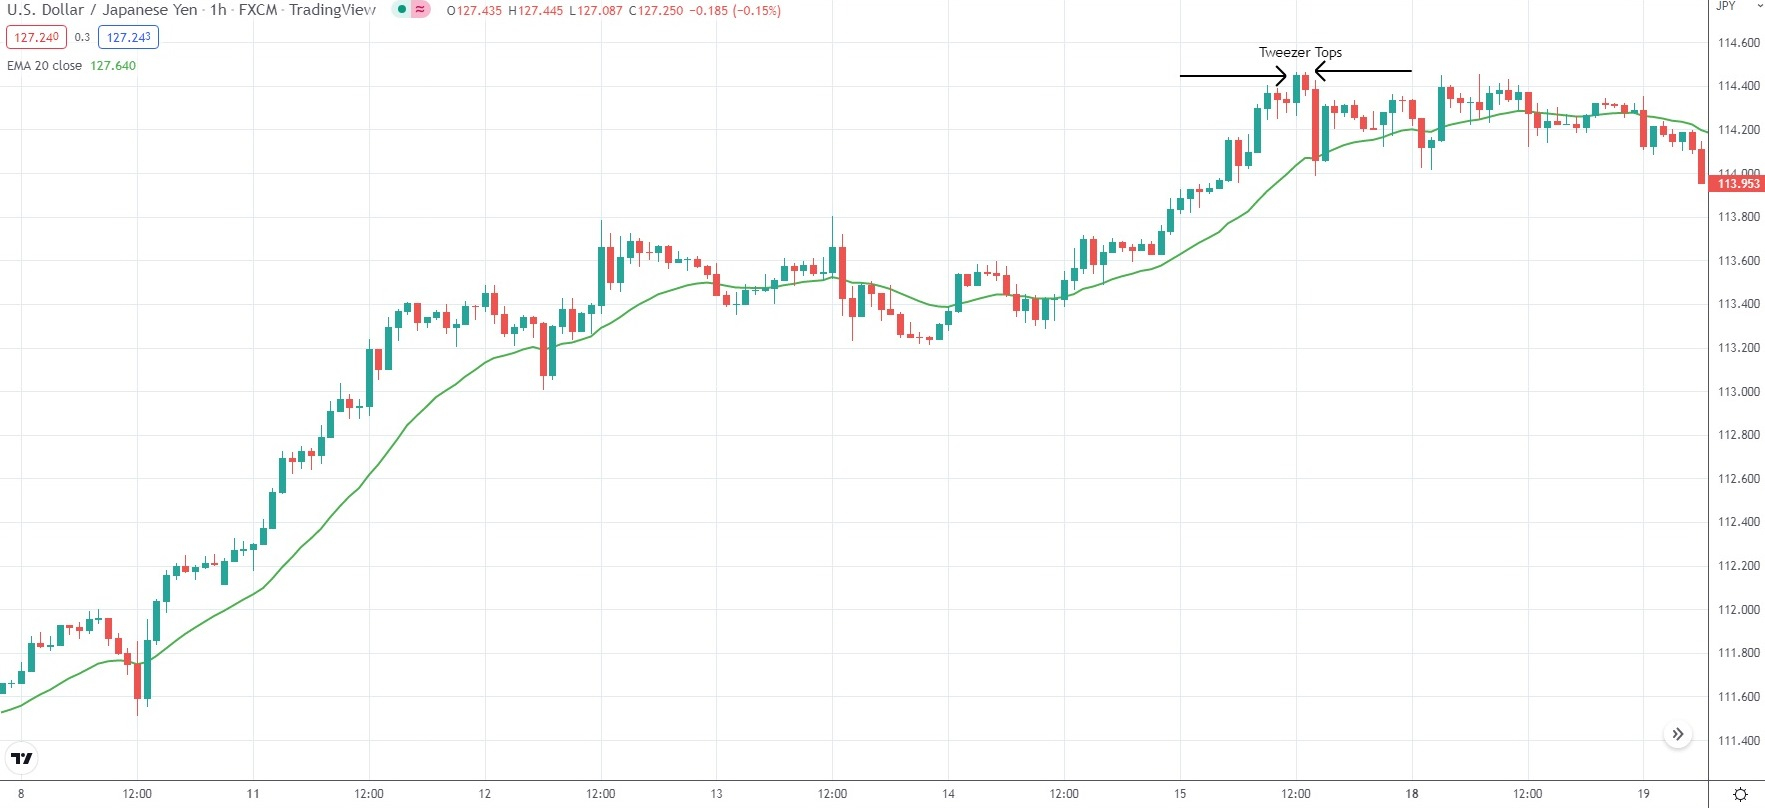
Tweezer Tops and Tweezer Bottoms are another type of two-candle reversal pattern that often signals a change in market direction. These patterns usually occur at the end of an extended trend, indicating that the prevailing momentum is weakening.
A Tweezer Top forms at the end of an uptrend and suggests a potential bearish reversal. Both candles have similar highs, showing that buyers were unable to push the price any higher on the second attempt. The first candle is generally bullish, followed by a bearish candle of nearly equal height at the top. This symmetry highlights resistance and signals a shift in market sentiment.
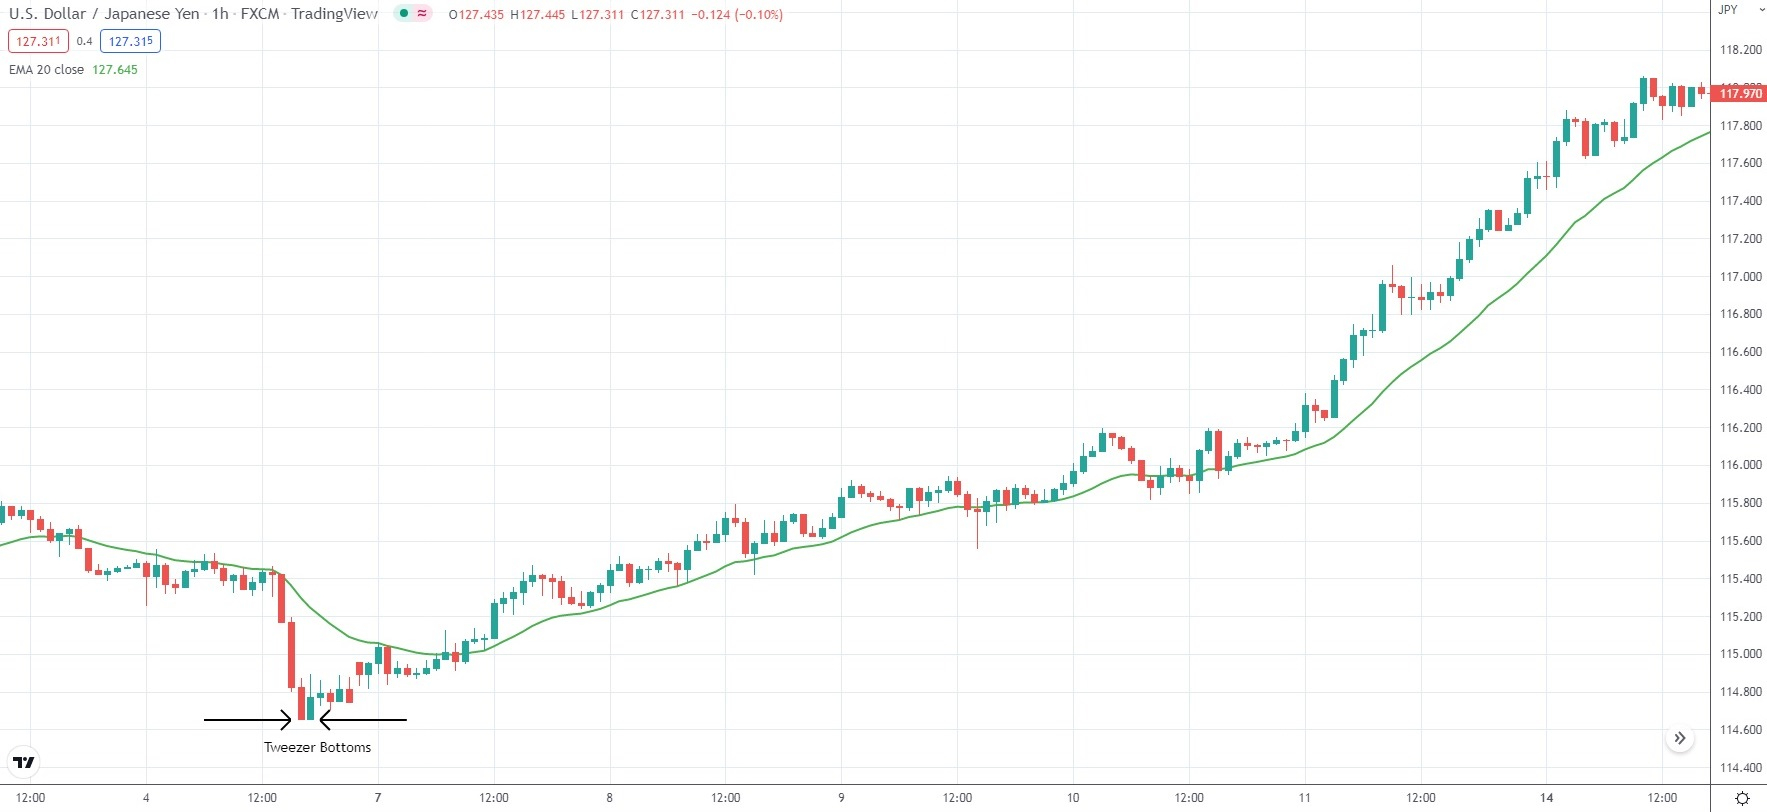
Conversely, a Tweezer Bottom appears after a downtrend and indicates a possible bullish reversal. In this case, both candles share similar lows, showing that sellers were unable to drive the price lower on the second attempt. The first candle is bearish, while the second is bullish, forming a mirrored structure that marks support.
While Tweezer patterns can be powerful reversal signals, their strength increases when they occur near significant support or resistance zones and are confirmed by higher trading volumes. Without such confirmation, the setup may lead only to a temporary pause in price movement rather than a full reversal.
Tweezer Tops, Tweezer Bottoms
Tweezers are also known for signaling potential trend reversals. A Tweezer Top is a bearish formation, suggesting that an ongoing bullish trend may be coming to an end. On the other hand, a Tweezer Bottom points to a bullish reversal, indicating that a prevailing bearish trend is likely reaching its conclusion.
Both Tweezer variations are made up of two opposing candlesticks—one bullish and one bearish—whose highs and lows align. For this pattern to be valid, the market should already be in a clear short-term or long-term trend.
In an uptrend, the wick of the first candlestick shows where buyers were overtaken by sellers. The wick of the second candle reflects another attempt by buyers to push the price higher. When bulls fail twice in succession, sellers take control and push the market downward.
For Tweezers to form, the candles must share matching highs or lows, whether in their bodies or wicks. Sometimes Engulfing patterns also show matching highs or lows, which can qualify as Tweezers. This means that more than two candles may take part in forming the pattern, as long as their highs or lows align.
The most reliable Tweezer formation occurs when both the candle bodies and wicks are nearly identical, making them look like “twins.” While the candles don’t need to be exactly the same size, and small differences in their highs or lows are acceptable, the closer they appear, the stronger the signal of a potential trend reversal.
Harami
The Engulfing pattern is a two-candle formation consisting of one large candlestick (either bullish or bearish) followed by a smaller candlestick, whose body is entirely contained within the body of the first candle. The smaller candlestick is often referred to as a spinning top and may take the form of a Doji, Hammer, Hanging Man, or Shooting Star.
When identifying this pattern, traders should focus on whether the second candle’s body lies completely within the open-close range of the first candle. The wicks of the smaller candle do not necessarily need to fall within the range of the larger candle. In practice, this means that the open-close relationship is more significant than the high-low extremes when evaluating an Engulfing formation.
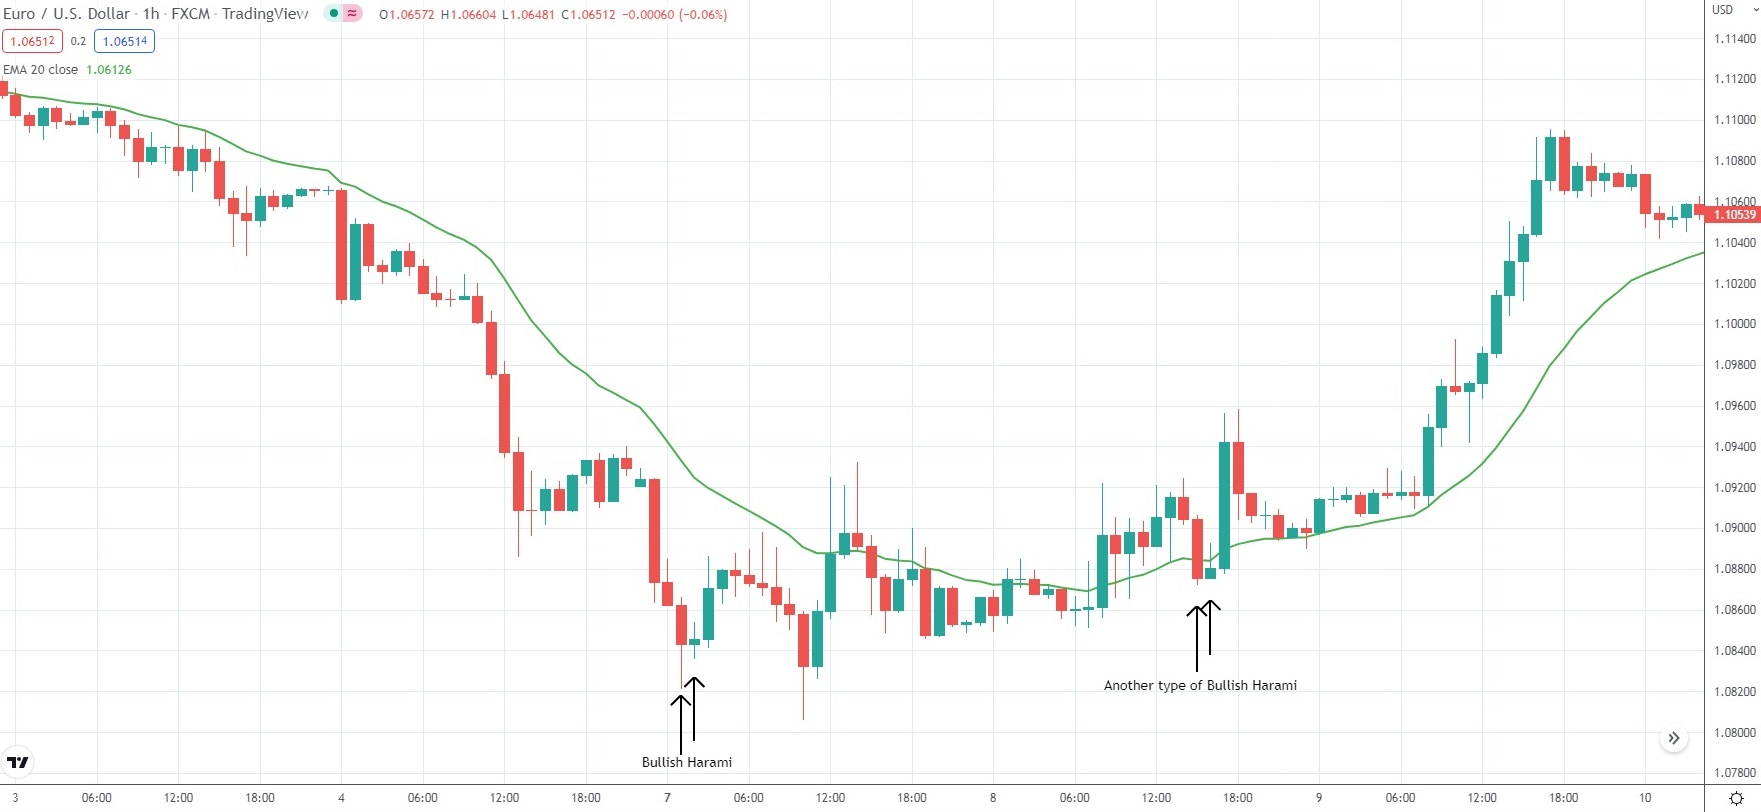
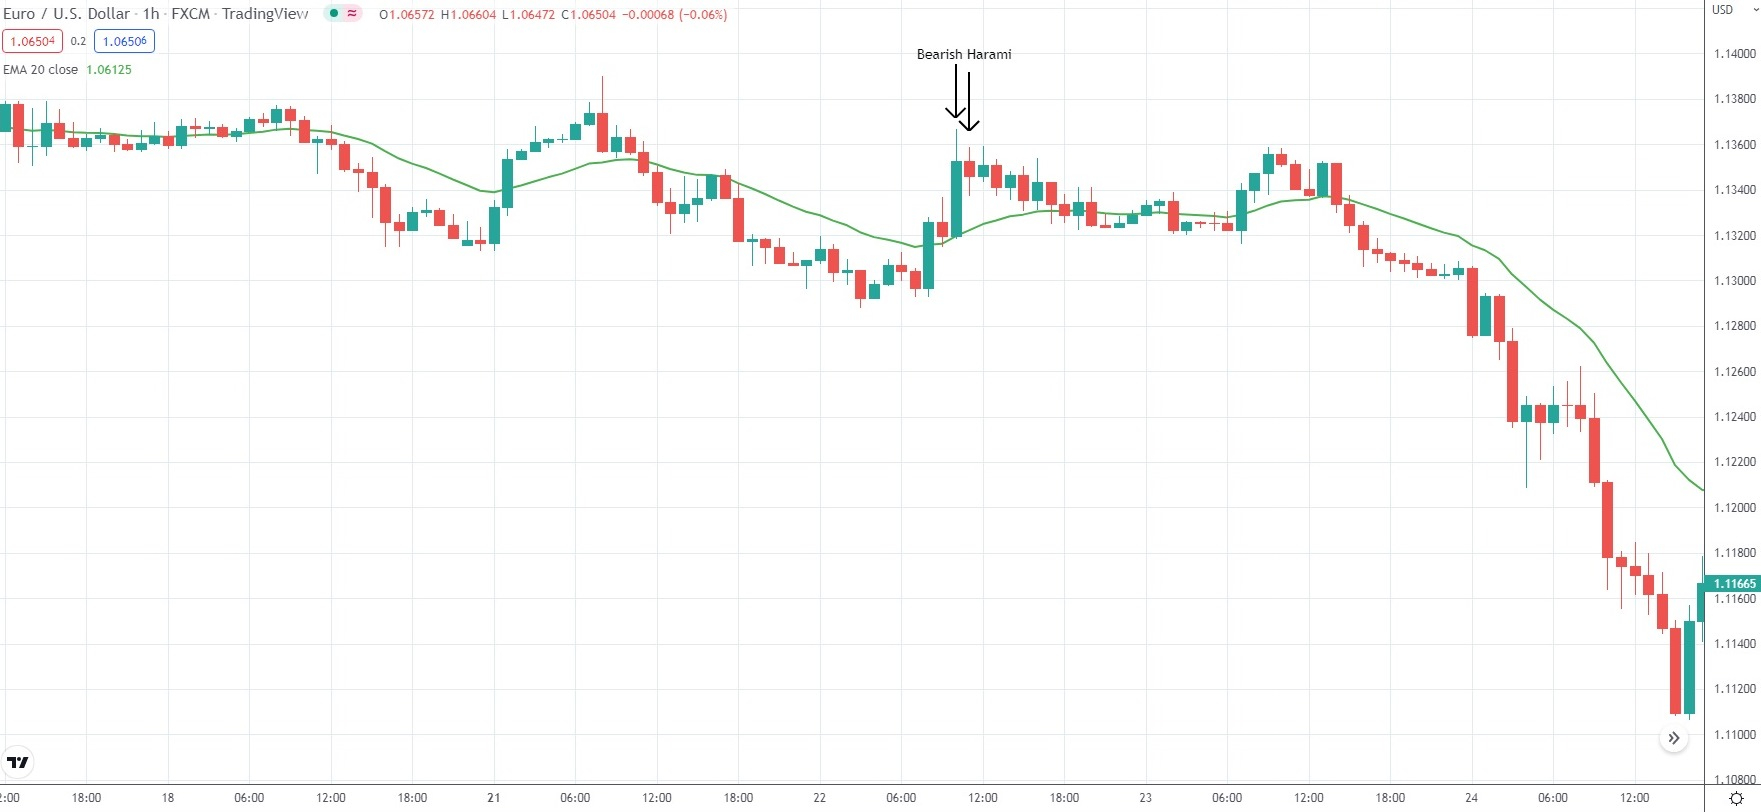
The appearance of the second small-bodied candlestick indicates reduced market volatility. In the short term, this is often followed by a sharp increase in volatility, marking the potential start of a new trend. As a result, the Harami pattern can signal either a reversal of the current trend or its continuation, depending on the direction of the breakout.
With that covered, we can now move on to price patterns that are formed by three candlesticks.
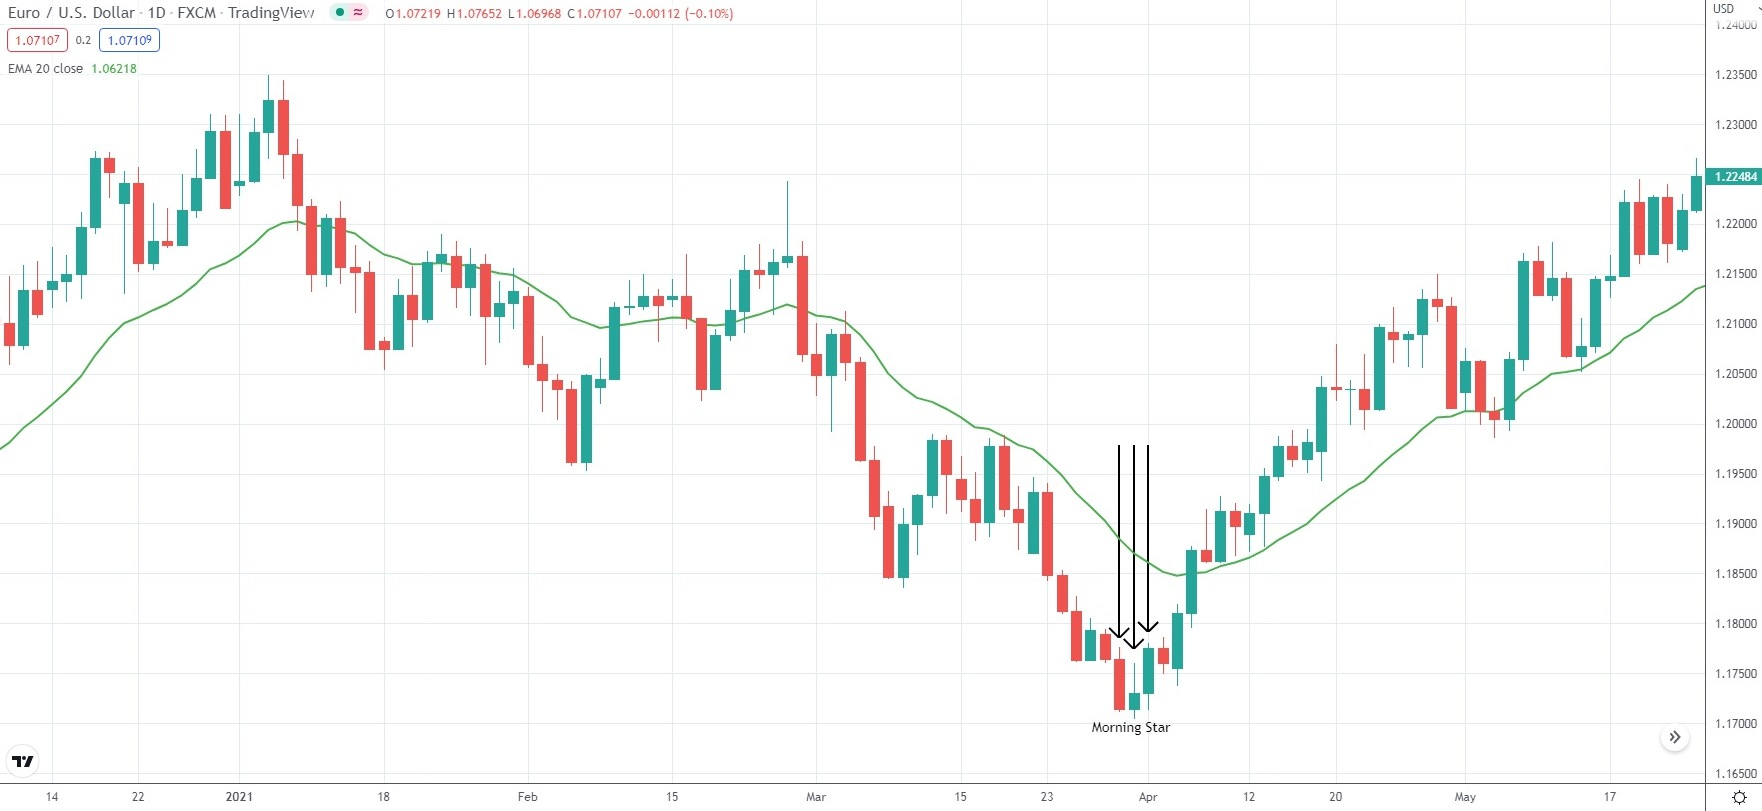
Evening Star, Morning Star
Both patterns indicate a potential trend reversal. The Evening Star is a three-candle bearish formation that typically appears at the peak of a market, marking the possible end of a bullish trend. The first candle is a large bullish one, followed by a smaller candle known as the “star.” Similar to the Dark Cloud Cover, the star appears after an opening gap. However, while its body forms, it should not overlap with the body of the first large bullish candle.
The star candle itself may be bullish, bearish, or even take the shape of a Doji, in which case the formation is referred to as an “Evening Doji Star.” Regardless of its type, the star always reflects hesitation and a sudden pause in upward momentum.
For the Evening Star to be valid, the third candle must be a large bearish one. This confirms that sellers have taken control after the indecision shown by the star. Ideally, the body of this bearish candle should not overlap the star, though this is not a strict rule, as such situations are rare. More importantly, the bearish candle must penetrate deeply into the body of the first bullish candle—typically by at least two-thirds, and in stronger cases, up to three-quarters of its height. This level of penetration is what gives the Evening Star its strong reversal signal.
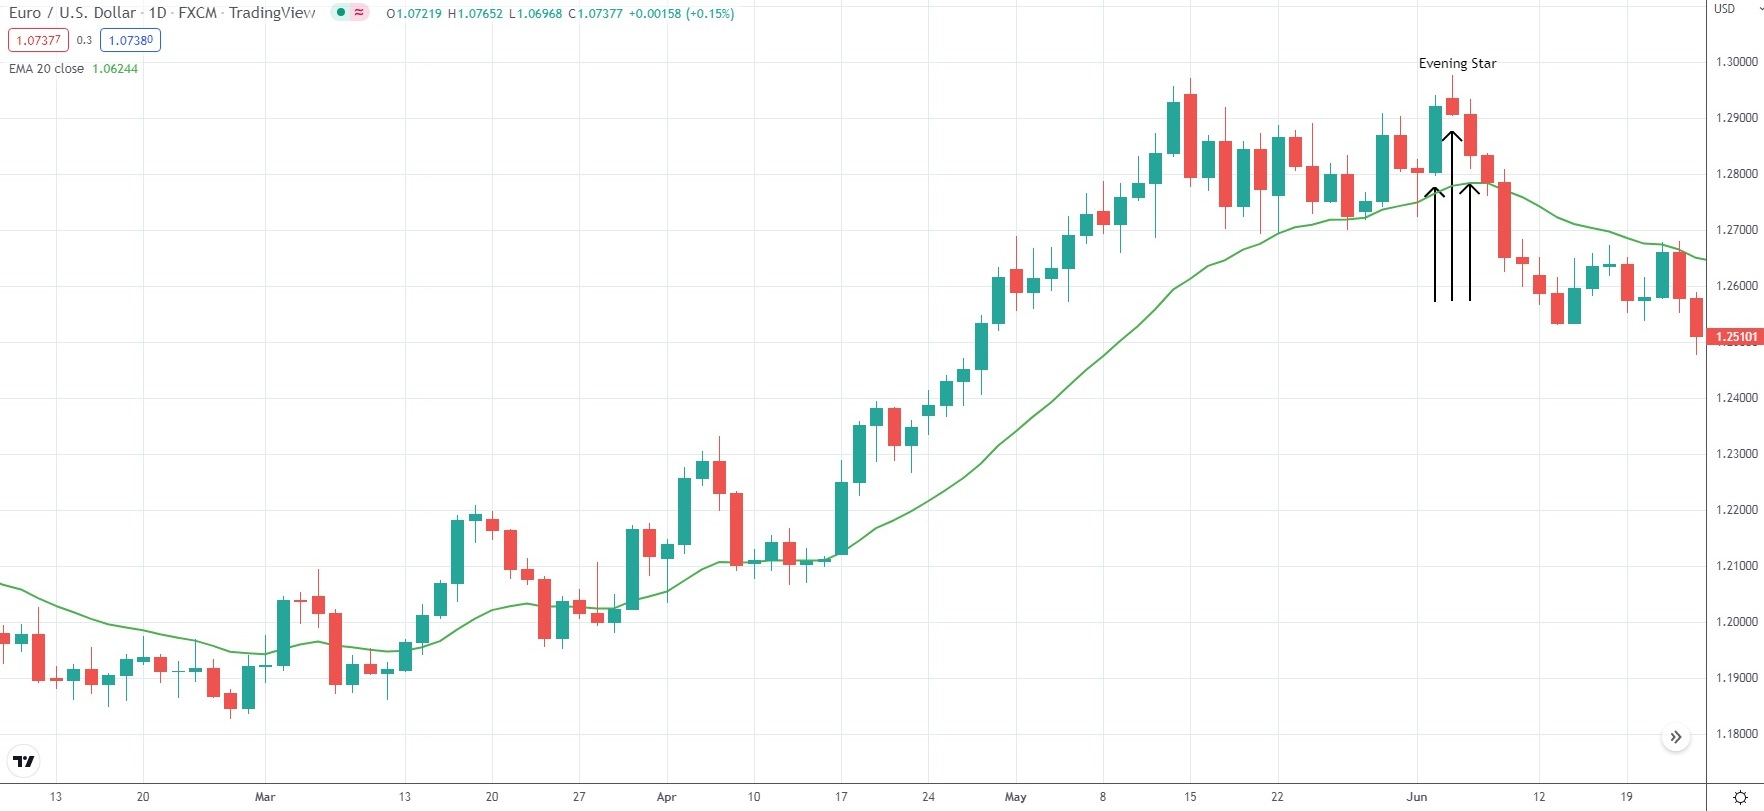
If the market closes above the high of the pattern, the Evening Star setup is considered invalid. On the other hand, if the market closes below the low of the pattern, the formation is confirmed as valid. The Morning Star is the bullish counterpart of this pattern, and the same conditions apply but in the opposite direction.
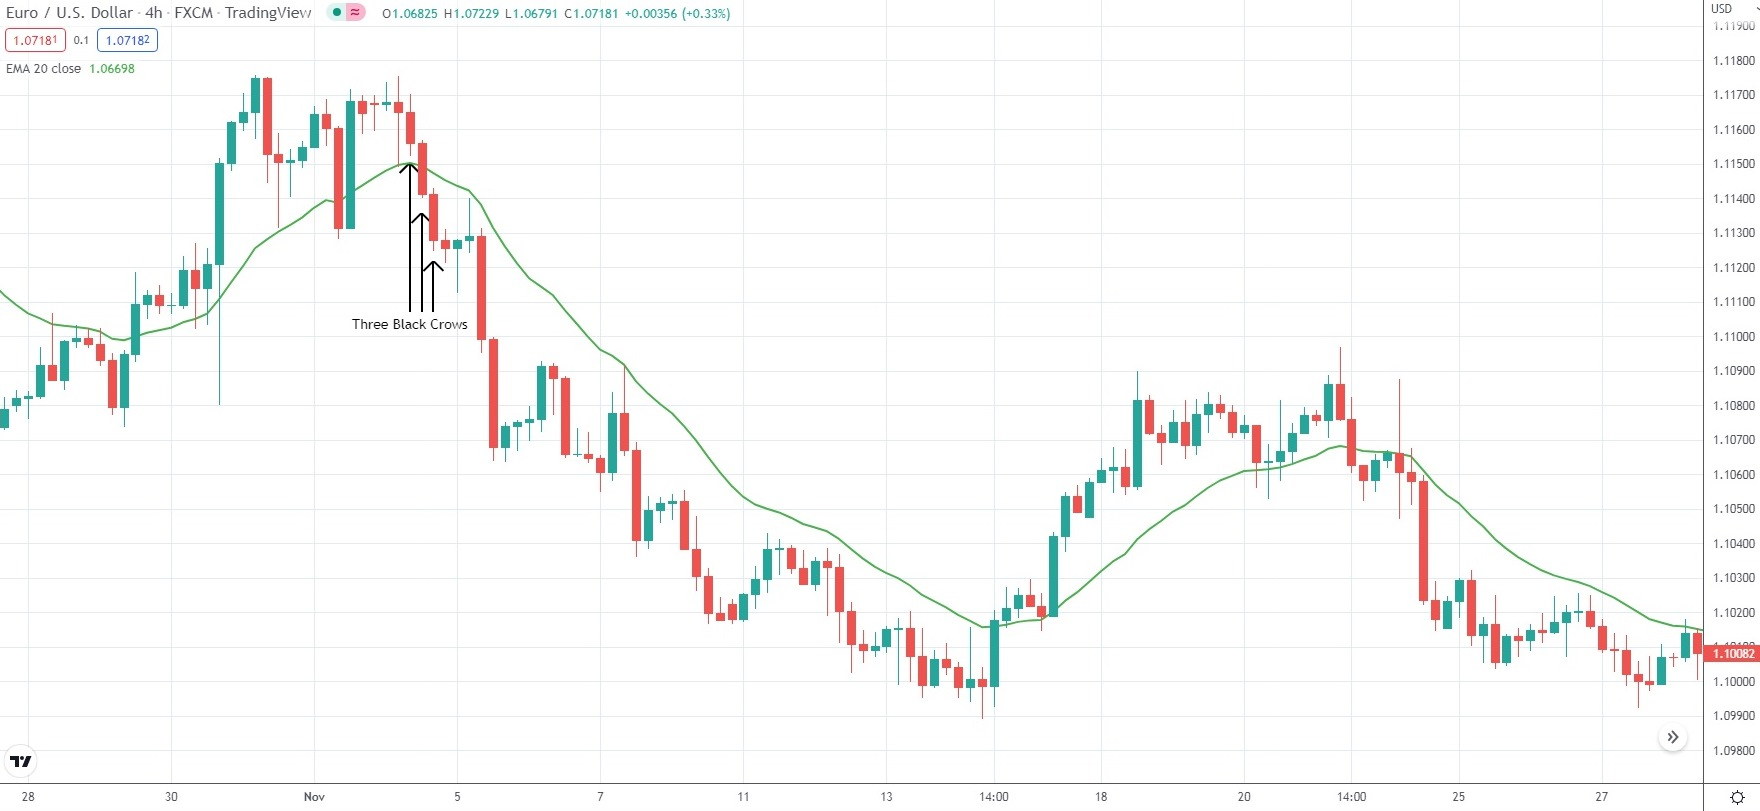
Three White Soldiers, Three Black Crows
Both patterns are made up of three consecutive candlesticks of the same color. The Three White Soldiers pattern indicates a bullish reversal, while the Three Black Crows pattern points to a bearish reversal.
In the case of the Three White Soldiers, the pattern consists of three consecutive bullish candles of similar size, usually forming after a downtrend. The second candle is larger than the first, and the third is at least equal in size to the second. If the third candle is noticeably smaller, it suggests that buyers lack full control, which could prevent the downtrend from reversing.
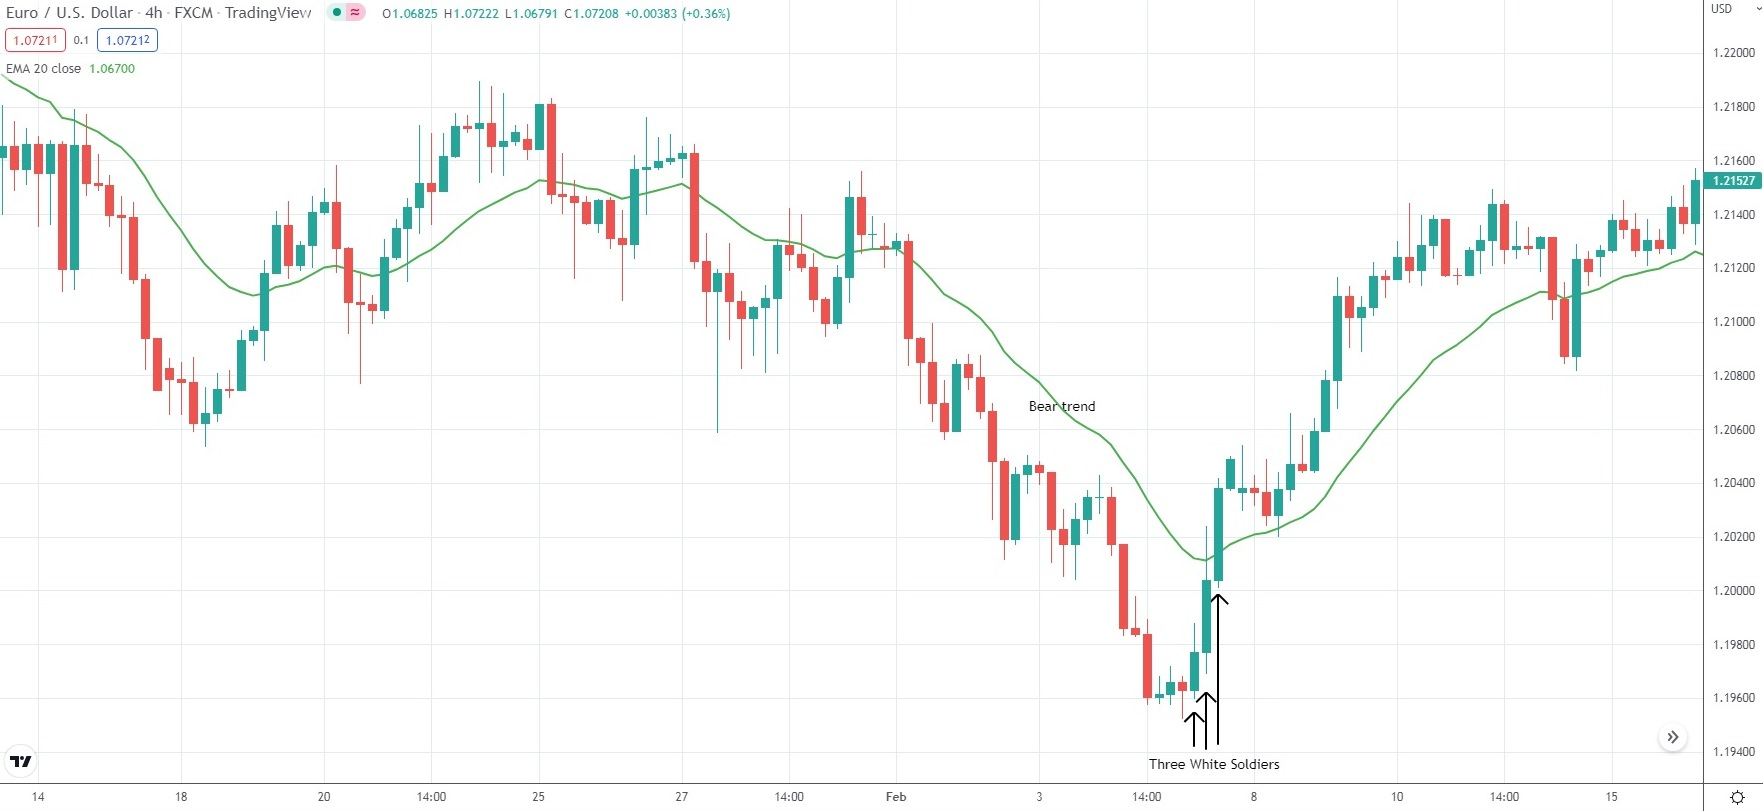
The Three White Soldiers pattern requires each candle to open within the body of the previous candle or at its high. Traders should be cautious of excessively long bodies, as these may indicate that the instrument is becoming overbought and due for a retracement. For the pattern to be reliable, the candles should be relatively long with small or no upper wicks, ideally closing at or near their highs. If the wicks are too long and rival or exceed the candle bodies in length, it signals that sellers are still exerting pressure. The pattern is more convincing when the opening of the second and third candles aligns closely with the closing of the first and second candles, respectively. Its strength is further reinforced if it emerges after a prolonged downtrend and a period of consolidation, distinguishing it from a weaker Three White Soldiers setup.
The Three Black Crows pattern, on the other hand, consists of three consecutive bearish candles of similar size and typically appears after an uptrend. Each candle opens within the body of the previous candle or at its low, maintaining continuity in downward momentum. Ideally, these candles should be long with minimal or no lower wicks, closing near their lows to show persistent selling pressure. A noticeably smaller third candle could indicate weakening bearish control, while overly extended bodies may point to oversold conditions, increasing the likelihood of a short-term rebound.
Bullish Abandoned Baby Pattern
This is a three candle pattern that forms in an existing bear trend and signals the potential reversal of that trend. Price action traders expect that once the pattern has been completed, the market will continue to move higher, as selling has been exhausted (at least for now). There are certain criteria required for the Bullish Abandoned Baby pattern to form:
First of all, the first candle is a large bearish one and it is part of a defined bear trend
Second, the next candle is a Doji that gaps below the closing price of the first candle
Third, the final candle is a large bullish one that opens above the Doji and demonstrates aggressive movement to the upside.
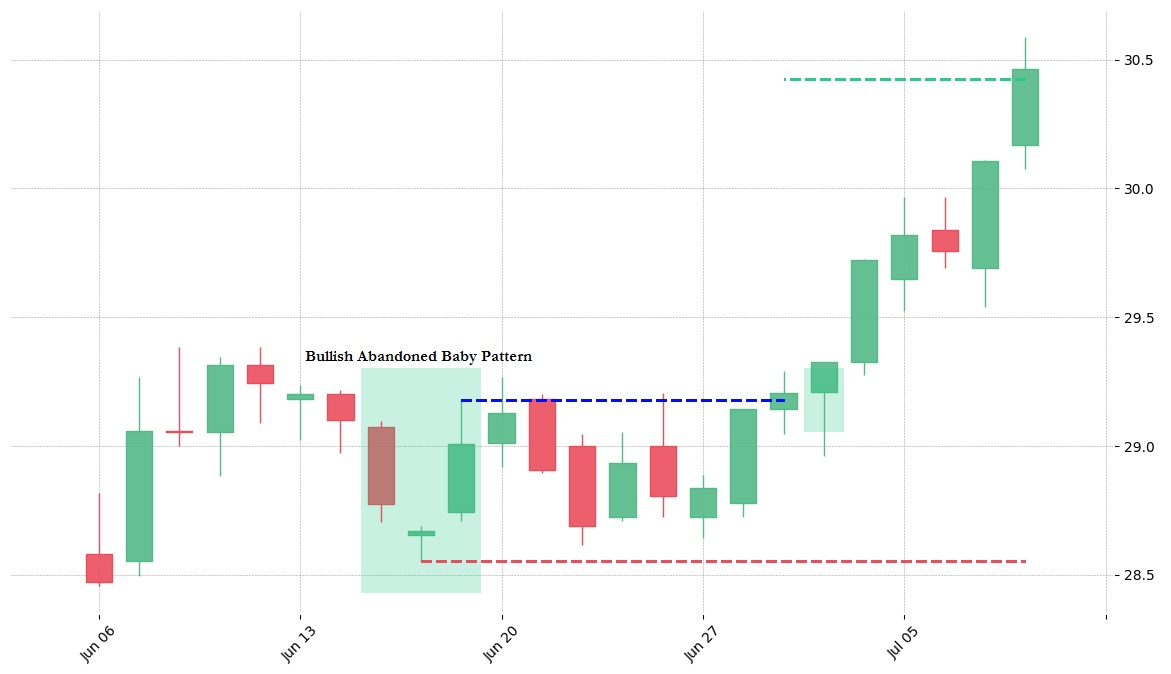
This pattern forms when the market has been in a clear bearish trend, followed by another sharp sell-off, which is reflected in the first large bearish candle. The Doji that follows shows that selling pressure has leveled off, with the candle opening and closing at nearly the same price. This signals that bearish momentum is weakening and buyers are beginning to step in. The Doji is then followed by a strong bullish candle that gaps higher, confirming that buyers have taken control while sellers have been exhausted for the time being.
In some cases, instead of one Doji, two or even three Doji candles may form before the market turns upward. This setup is still regarded as a Bullish Abandoned Baby pattern, as it represents a steep decline, a pause with indecision, and then a decisive shift to the upside.
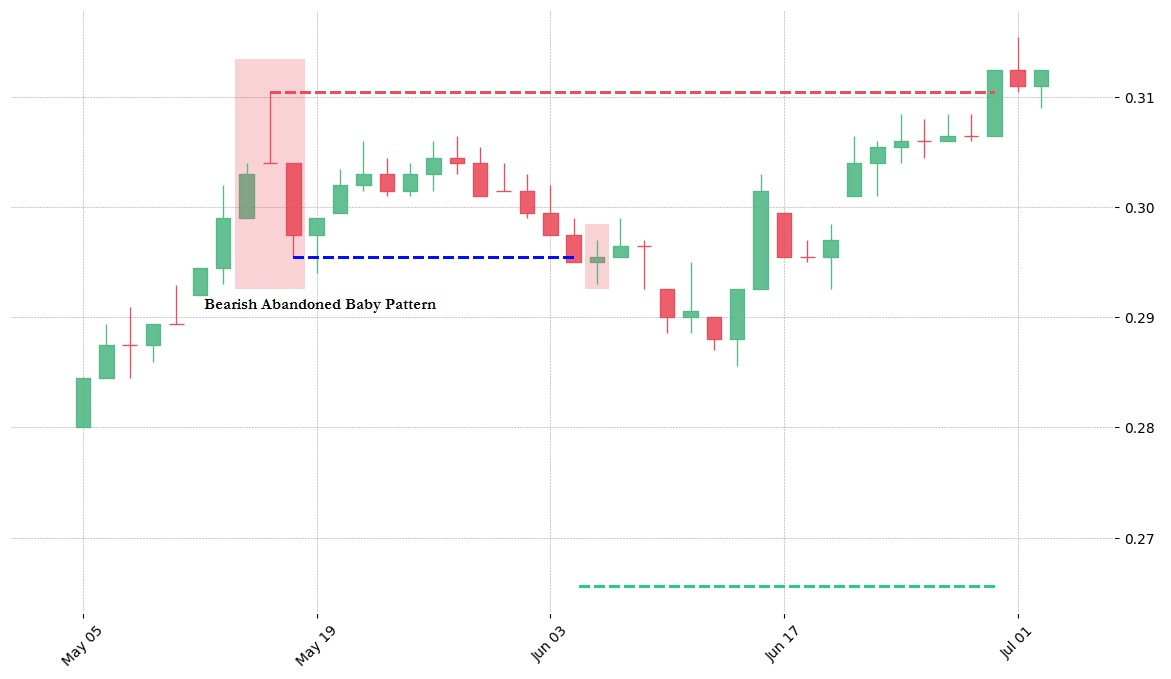
Bearish Abandoned Baby Pattern
This is a three-candle pattern that forms in an existing bull trend and signals its potential reversal. Price action traders expect that once the pattern has been completed, the market will continue to move lower, as buying has been exhausted for the time being. There are certain criteria that will need to be met for the Bearish Abandoned Baby pattern to form:
First of all, the first candle is a large bullish one and it is part of a defined bull trend
Second, the next candle is a Doji that gaps above the closing price of the first candle
Third, the final candle is a large bearish one that opens below the Doji and demonstrates aggressive movement to the downside.
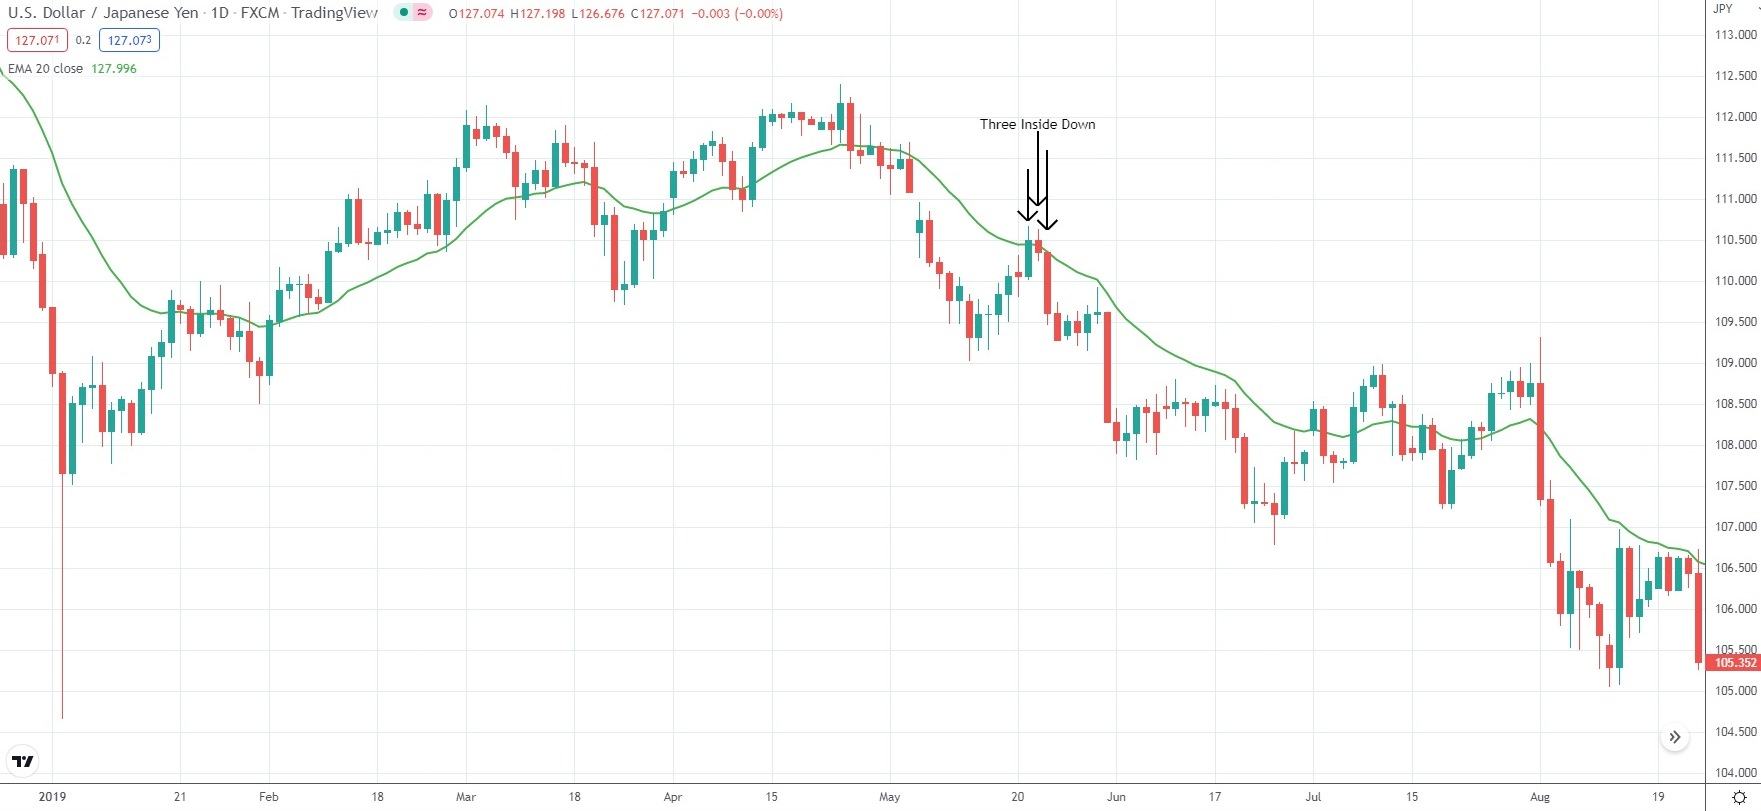
Three Inside Up, Three Inside Down
The Three Inside Up is a bullish reversal pattern that generally forms at the bottom of a downtrend, while its opposite, the Three Inside Down, is bearish and tends to appear at market tops. The Three Inside Up usually develops after a prolonged bear trend and often aligns with a key support area. However, this pattern does not always guarantee a trend reversal; it may also signal a temporary pause or correction in the market. The sequence begins with a large bearish candle, followed by a smaller bullish spinning top or Doji, creating a Harami structure.
For confirmation, the smaller second candle must close at or above the midpoint of the first candle’s body. The third candle is then a strong bullish one that closes above the body of the first candle. The signal becomes even more reliable if this third candle closes higher than the first candle’s peak, suggesting stronger bullish momentum.
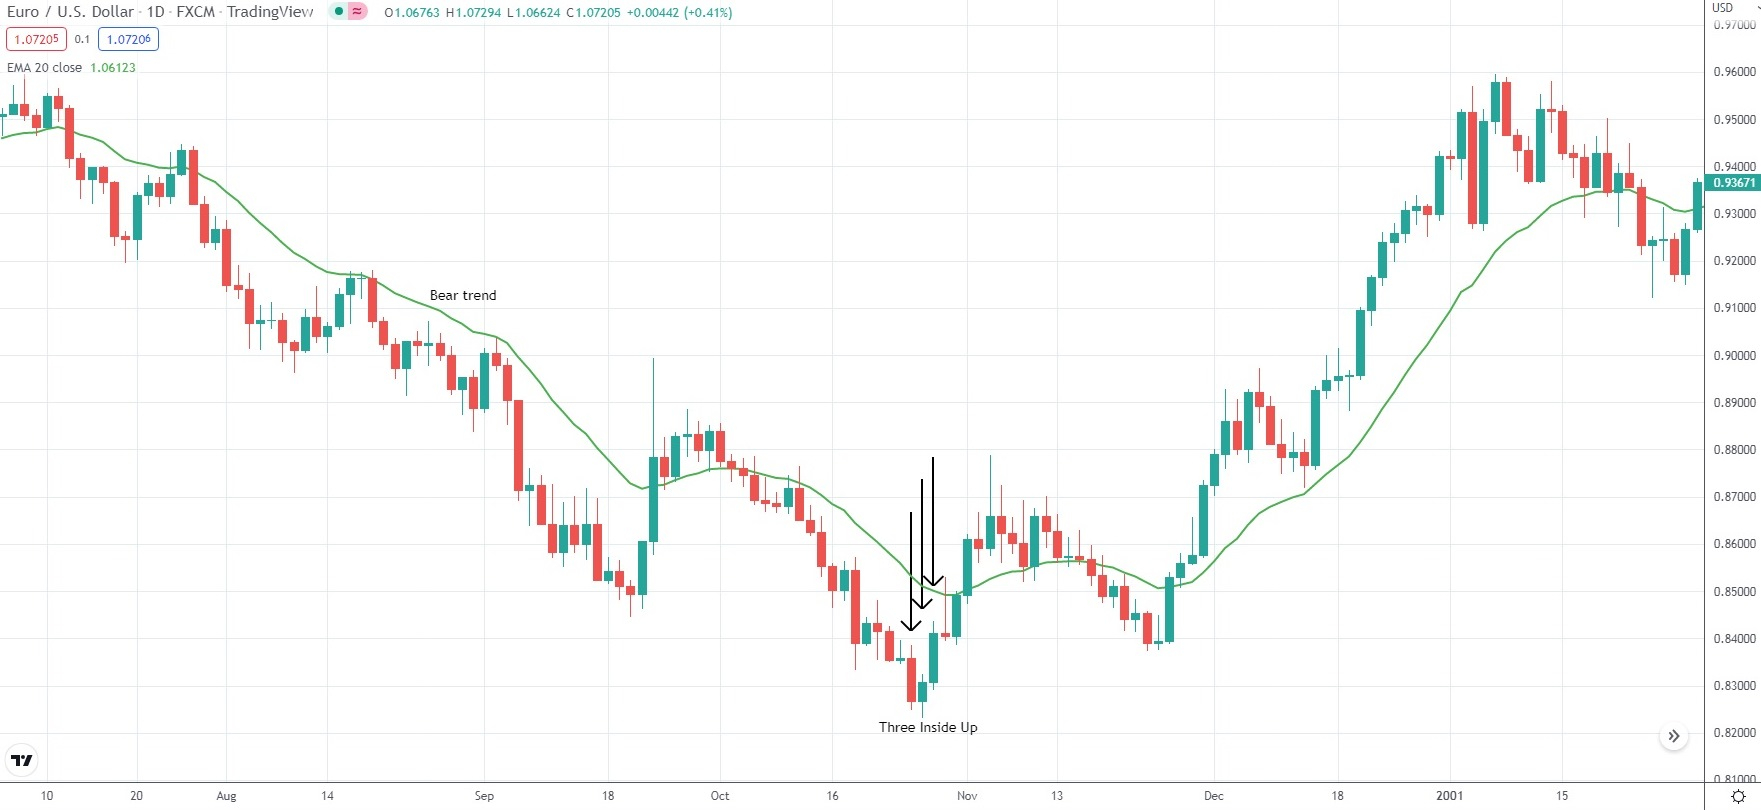
The Three Inside Up pattern shares similarities with the Morning Star, but it is considered more powerful. In this case, the second candle, which is smaller and signals indecision, does not push the market to a new high or low before the opposing side—in this case, the bulls—take control. By the time the third candle starts forming, bullish momentum is already dominant, allowing buyers to push the price even higher than what is typically seen in the Morning Star pattern. This makes the Three Inside Up a stronger indication of potential upward movement.
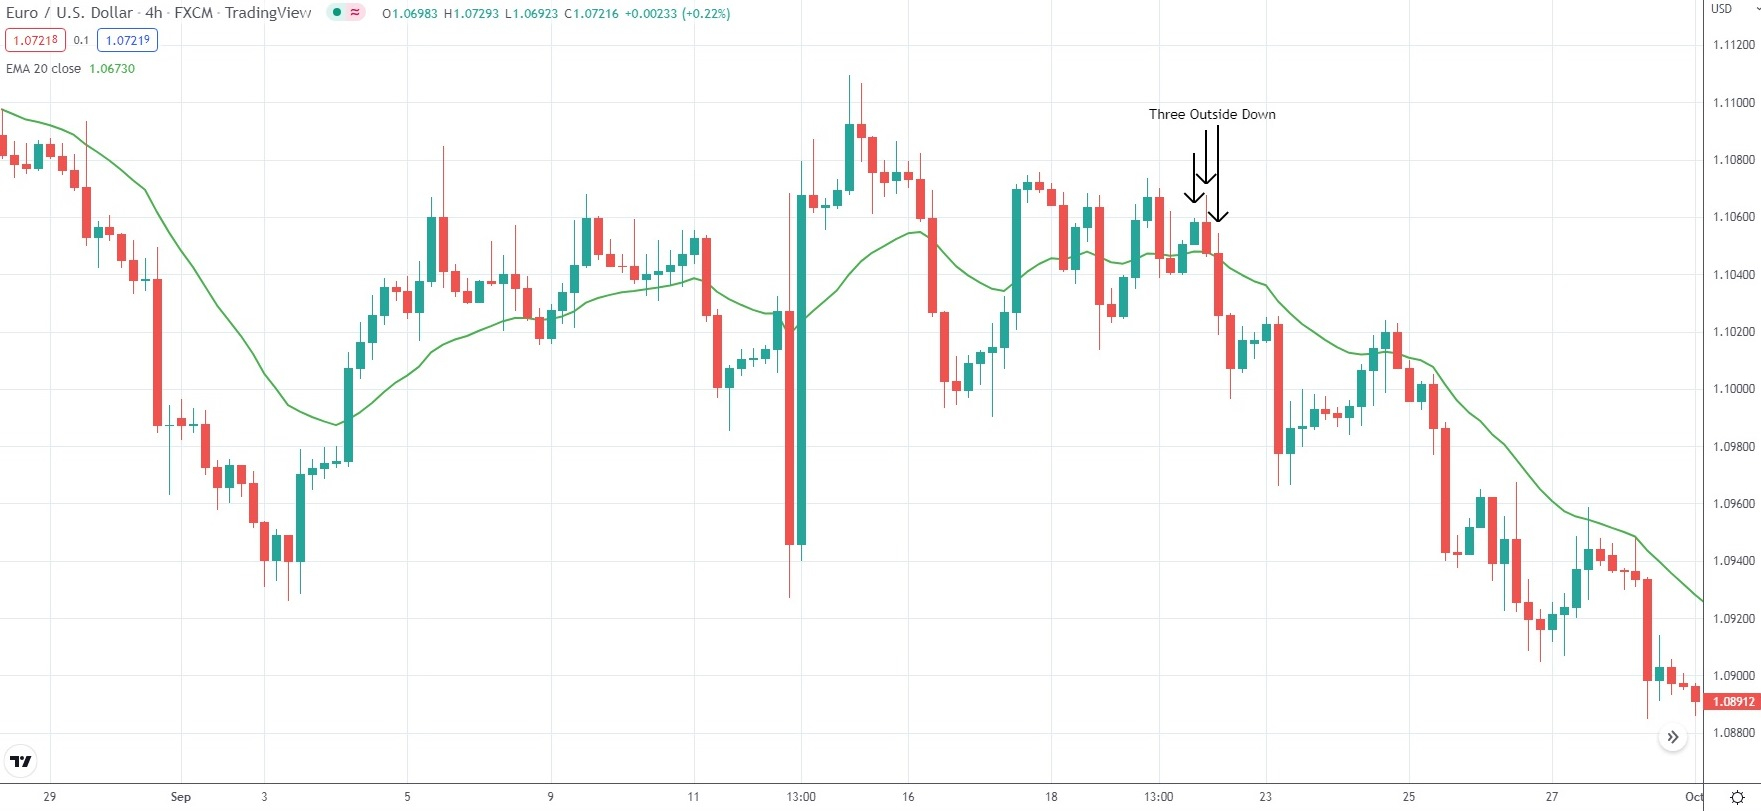
Three Outside Up, Three Outside Down
The Three Outside Up is a bullish reversal pattern that typically forms at market lows. It begins with a small bearish candle, often a spinning top, that reflects the prevailing downtrend. The second candle is a strong bullish one that completely engulfs the body of the first, signaling a shift in momentum. This engulfing action is what sets the foundation of the reversal. The pattern is confirmed with the third candle, which is also bullish and closes above the second candle, pushing the price to a new high beyond the top of the engulfing formation. This sequence strengthens the signal of a potential trend reversal and highlights growing buying pressure.
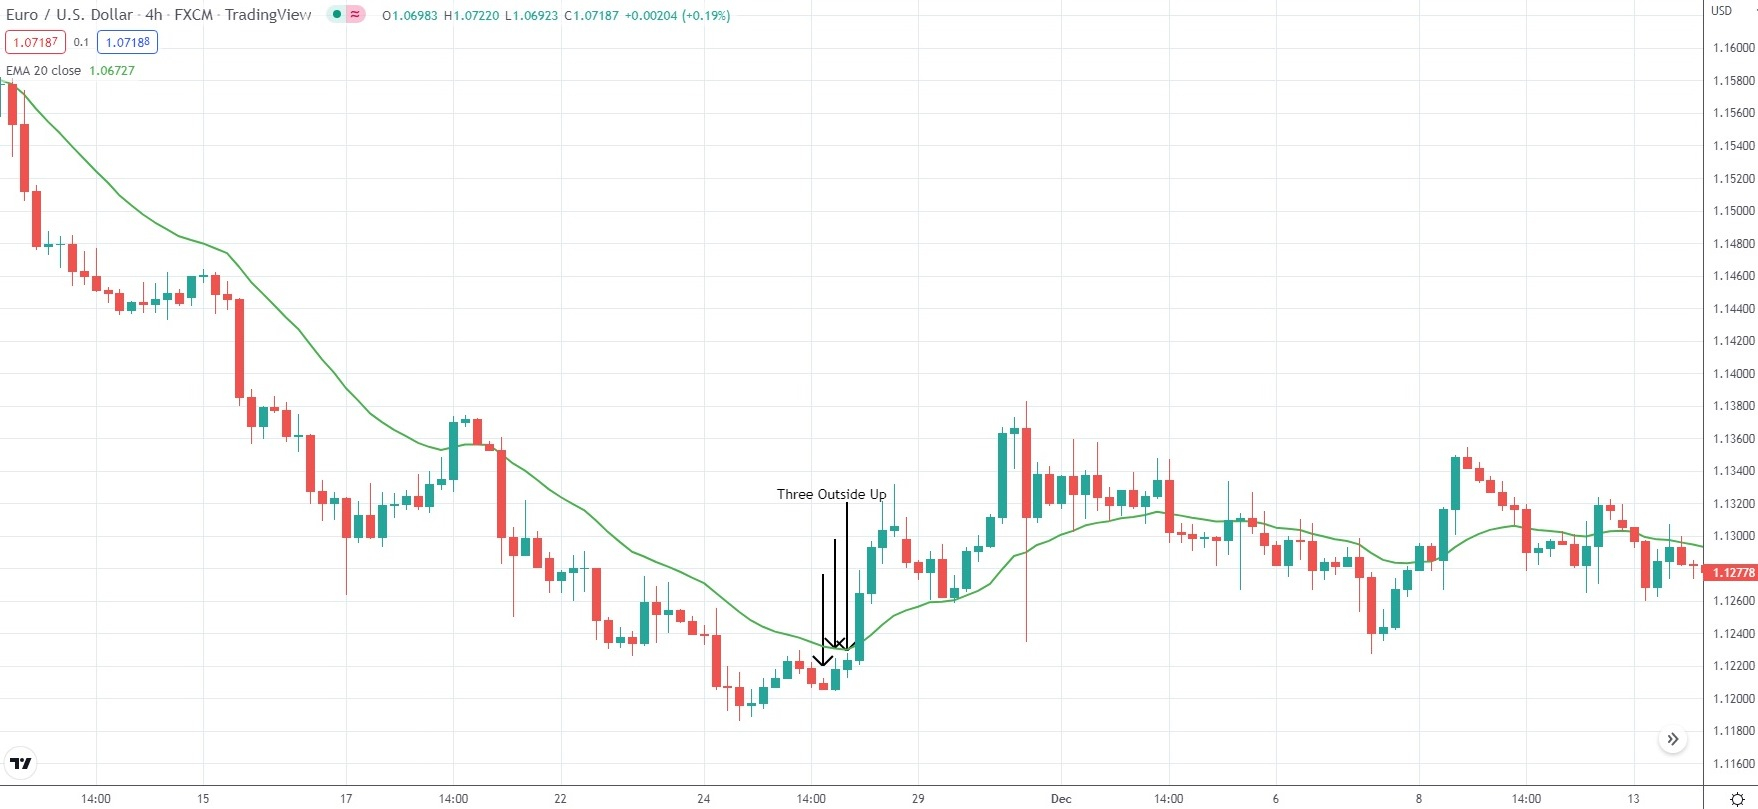
The Three Outside Up pattern is generally seen as less dependable than other three-candle formations. This is because outside candles tend to be less predictable and less profitable when compared to inside candles, such as those found in the Morning Star, Evening Star, or Three Inside Up/Three Inside Down patterns.
With that in mind, let’s now shift our focus toward several candlestick setups that signal trend continuation rather than reversal.
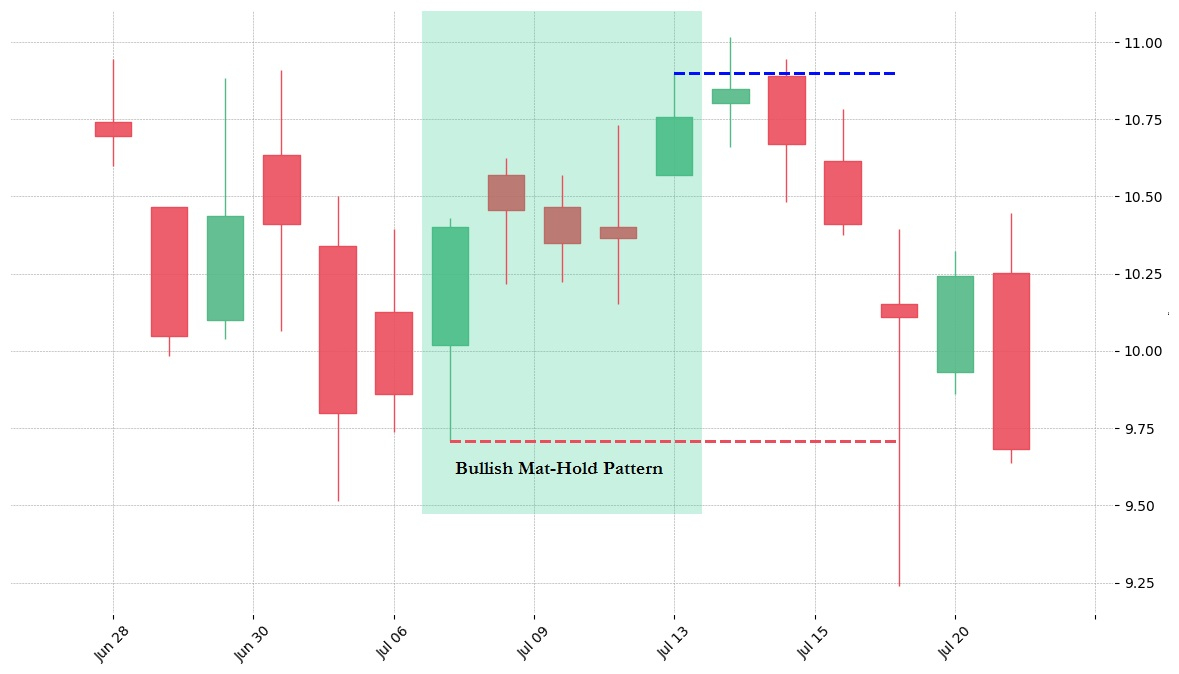
Mat-Hold Pattern
The Double Top is a bearish reversal pattern that resembles the letter “M” and typically forms after an uptrend. It signals a potential opportunity for traders to enter short positions. In this pattern, the price reaches two peaks separated by a trough, forming a “neckline” at the bottom of the formation.
A valid Double Top pattern usually exhibits the following key characteristics:
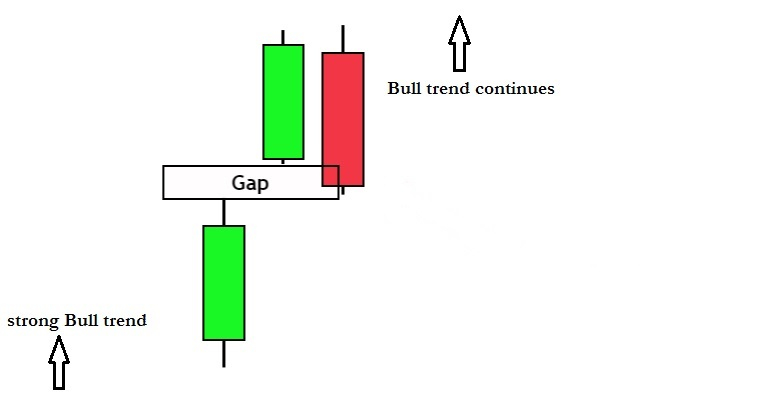
Upside Tasuki Gap
This formation is a three-candle bullish continuation pattern that develops within an ongoing uptrend. It begins with a strong bullish candle, followed by another bullish candle that opens with a gap up, reinforcing the strength of the prevailing trend. The third candle is bearish and moves into the gap created between the first two bullish candlesticks. However, for the setup to remain valid, this bearish candle should not fully close the gap. The inability to fill the gap reflects that buying pressure is still dominant, and the bullish momentum remains intact. Once this structure is complete, additional upward price action often serves as confirmation that the uptrend is likely to continue.
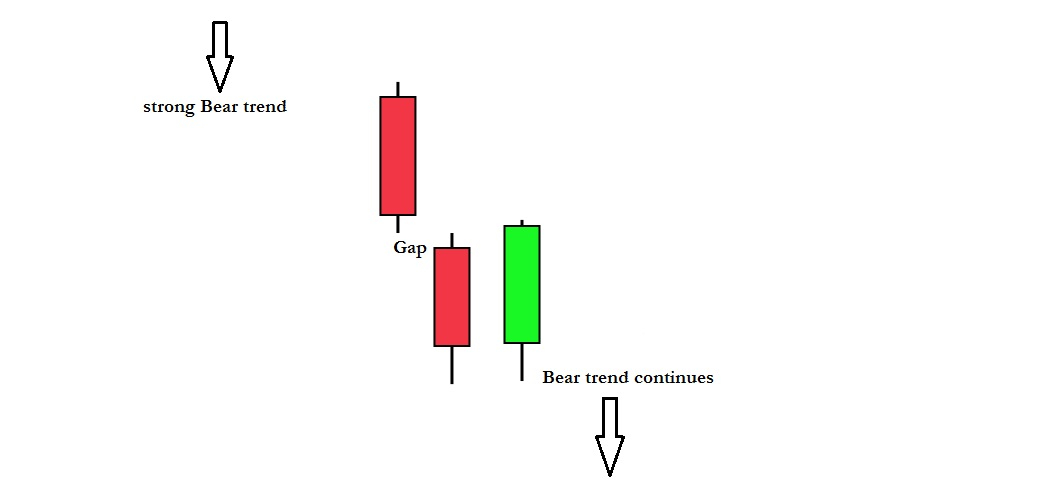
Downside Tasuki Gap
This pattern is a three-candle bearish continuation setup that forms within an ongoing downtrend. It begins with a large bearish candle, followed by another bearish candle that opens with a gap down, reinforcing the strength of the prevailing selling pressure. The third candle is bullish and moves into the gap created by the first two bearish candles. However, it should not completely close this gap, as the inability to do so reflects that buyers lack sufficient strength to reverse the trend. This failure signals that bearish momentum remains dominant, and the downtrend is likely to continue.
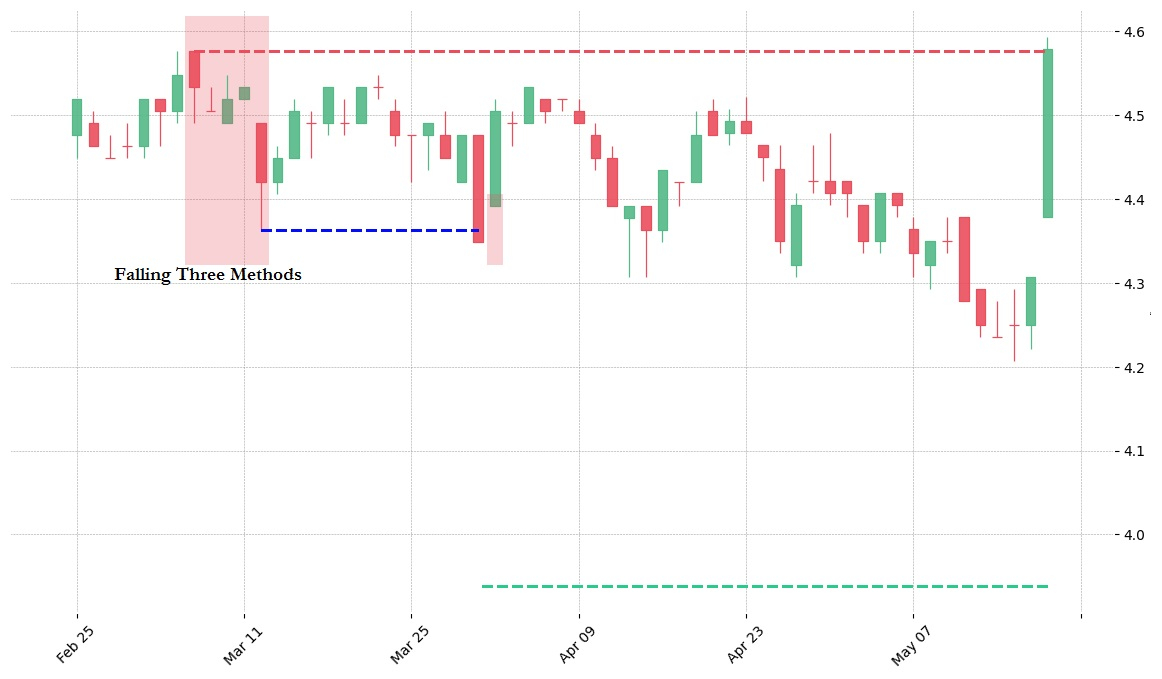
Falling Three Methods Pattern
This is a five-candle bearish continuation pattern that signals a brief pause in the ongoing downtrend rather than a reversal. It begins with a large bearish candle, followed by three small bullish candles that move against the prevailing trend but remain within the range of the first candle. The pattern concludes with another strong bearish candle, confirming that selling pressure has regained control. The presence of the three counter-trend candles reflects temporary buying activity, but their limited strength highlights that buyers are unable to challenge the dominant bearish momentum, suggesting the downtrend is likely to continue.
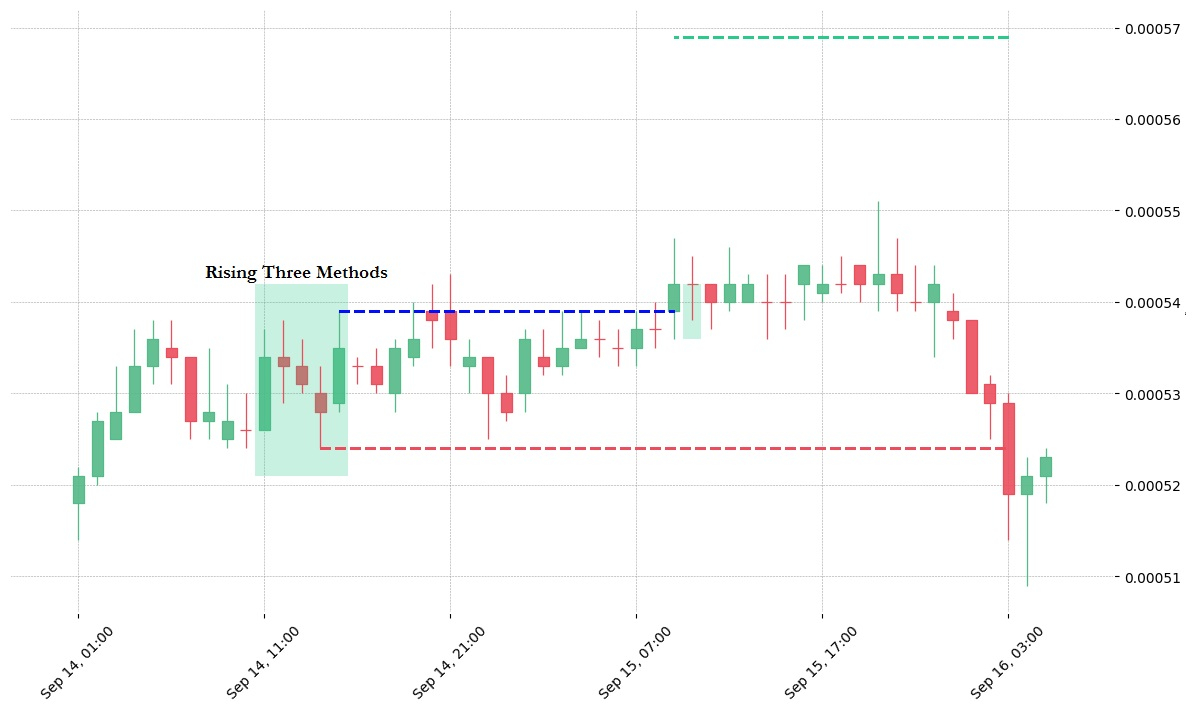
Rising Three Methods Pattern
This is a five-candle bullish continuation pattern that represents a brief consolidation within an ongoing uptrend, without signaling a reversal. It starts with a strong bullish candle, followed by three small bearish candles that retrace slightly but remain within the range of the first candle. The pattern ends with another large bullish candle, confirming the dominance of buyers. The presence of the three counter-trend candles shows temporary selling pressure, but their weakness highlights that sellers lack the strength to challenge the prevailing bullish momentum, suggesting the uptrend is likely to resume.
Conclusion
Price action trading focuses on recent historical data and incorporates all key elements of technical analysis, including charts, trend lines, price channels, swing highs and lows, support and resistance zones, and consolidation phases. Traders who rely on this approach often study recurring patterns such as breakouts, retracements, and candlestick formations to anticipate market direction. Unlike traditional technical analysis, which might depend on indicators such as moving average crossovers to generate uniform trading signals, price action trading emphasizes interpreting raw market movements directly.
An important part of this method involves psychological and behavioral factors, as traders may interpret the same market setup differently based on their own rules, risk tolerance, and understanding of market behavior. This subjectivity makes price action trading highly individualistic.
The approach is generally more suitable for short- to medium-term opportunities rather than long-term investing. Many traders argue that financial markets are too random for a system to work with absolute consistency, which is why price action has grown in popularity. It allows traders to combine technical structures with recent market behavior to identify setups that align with their own reading of conditions.
Because price action strategies are self-defined, they offer flexibility across multiple asset classes and can be backtested or applied through any trading platform. While technical tools may support the process, the decision to enter or exit a trade rests entirely on the trader’s judgment. Ultimately, price action trading provides a more adaptable approach, giving traders freedom from rigid rules and the ability to respond to changing market dynamics.